 |
| 1 | |
Time periods of prosperity followed by periods of recession that occur over extended periods of time is called |
| | A) | secular trend |
| | B) | seasonal variation |
| | C) | cyclical variation |
| | D) | irregular variation |
|
|
|
| 2 | |
Within a year, a pattern of high and low sales is called |
| | A) | secular trend. |
| | B) | seasonal variation. |
| | C) | cyclical variation. |
| | D) | irregular variation. |
|
|
|
| 3 | |
A linear trend for time series data beginning in 2004 and extending up through 2009 (data for 6 years) is 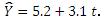 <a onClick="window.open('/olcweb/cgi/pluginpop.cgi?it=jpg::::/sites/dl/free/0073401765/663702/C16_img1.jpg','popWin', 'width=NaN,height=NaN,resizable,scrollbars');" href="#"><img valign="absmiddle" height="16" width="16" border="0" src="/olcweb/styles/shared/linkicons/image.gif"> (4.0K)</a>The forecast for 2010 is <a onClick="window.open('/olcweb/cgi/pluginpop.cgi?it=jpg::::/sites/dl/free/0073401765/663702/C16_img1.jpg','popWin', 'width=NaN,height=NaN,resizable,scrollbars');" href="#"><img valign="absmiddle" height="16" width="16" border="0" src="/olcweb/styles/shared/linkicons/image.gif"> (4.0K)</a>The forecast for 2010 is |
| | A) | 23.8 |
| | B) | 26.9 |
| | C) | 30.0 |
| | D) | 21.7 |
|
|
|
| 4 | |
The least squares equation for sales data going from 2004 to 2009 is 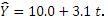 <a onClick="window.open('/olcweb/cgi/pluginpop.cgi?it=jpg::::/sites/dl/free/0073401765/663702/C16_img2.jpg','popWin', 'width=NaN,height=NaN,resizable,scrollbars');" href="#"><img valign="absmiddle" height="16" width="16" border="0" src="/olcweb/styles/shared/linkicons/image.gif"> (4.0K)</a> What are the plotted coordinates for the year 2007? <a onClick="window.open('/olcweb/cgi/pluginpop.cgi?it=jpg::::/sites/dl/free/0073401765/663702/C16_img2.jpg','popWin', 'width=NaN,height=NaN,resizable,scrollbars');" href="#"><img valign="absmiddle" height="16" width="16" border="0" src="/olcweb/styles/shared/linkicons/image.gif"> (4.0K)</a> What are the plotted coordinates for the year 2007? |
| | A) | t = 6, y = 17.8 |
| | B) | t = 0, y = 10.0 |
| | C) | t = 4, y = 15.2 |
| | D) | t = 10, y = 0.0 |
|
|
|
| 5 | |
The linear trend equation developed for the annual sales (in $thousands) of the Jordan Manufacturing Company is 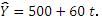 <a onClick="window.open('/olcweb/cgi/pluginpop.cgi?it=jpg::::/sites/dl/free/0073401765/663702/C16_img3.jpg','popWin', 'width=NaN,height=NaN,resizable,scrollbars');" href="#"><img valign="absmiddle" height="16" width="16" border="0" src="/olcweb/styles/shared/linkicons/image.gif"> (4.0K)</a> How much are sales increasing per year? <a onClick="window.open('/olcweb/cgi/pluginpop.cgi?it=jpg::::/sites/dl/free/0073401765/663702/C16_img3.jpg','popWin', 'width=NaN,height=NaN,resizable,scrollbars');" href="#"><img valign="absmiddle" height="16" width="16" border="0" src="/olcweb/styles/shared/linkicons/image.gif"> (4.0K)</a> How much are sales increasing per year? |
| | A) | $60,000 |
| | B) | $72,000 |
| | C) | $500,000 |
| | D) | $6,000 |
|
|
|
| 6 | |
For the linear trend equation  <a onClick="window.open('/olcweb/cgi/pluginpop.cgi?it=jpg::::/sites/dl/free/0073401765/663702/C16_img4.jpg','popWin', 'width=NaN,height=NaN,resizable,scrollbars');" href="#"><img valign="absmiddle" height="16" width="16" border="0" src="/olcweb/styles/shared/linkicons/image.gif"> (11.0K)</a>which symbol represents the average change in the dependent variable for each unit change in time? <a onClick="window.open('/olcweb/cgi/pluginpop.cgi?it=jpg::::/sites/dl/free/0073401765/663702/C16_img4.jpg','popWin', 'width=NaN,height=NaN,resizable,scrollbars');" href="#"><img valign="absmiddle" height="16" width="16" border="0" src="/olcweb/styles/shared/linkicons/image.gif"> (11.0K)</a>which symbol represents the average change in the dependent variable for each unit change in time? |
| | A) | a |
| | B) | b |
| | C) | X |
| | D) |  <a onClick="window.open('/olcweb/cgi/pluginpop.cgi?it=jpg::::/sites/dl/free/0073401765/663702/C13_img2.jpg','popWin', 'width=NaN,height=NaN,resizable,scrollbars');" href="#"><img valign="absmiddle" height="16" width="16" border="0" src="/olcweb/styles/shared/linkicons/image.gif"> (0.0K)</a> <a onClick="window.open('/olcweb/cgi/pluginpop.cgi?it=jpg::::/sites/dl/free/0073401765/663702/C13_img2.jpg','popWin', 'width=NaN,height=NaN,resizable,scrollbars');" href="#"><img valign="absmiddle" height="16" width="16" border="0" src="/olcweb/styles/shared/linkicons/image.gif"> (0.0K)</a> |
|
|
|
| 7 | |
A moving average is |
| | A) | Useful in smoothing a time series. |
| | B) | Used in measuring seasonal fluctuations. |
| | C) | A technique which does not result in an equation. |
| | D) | All of the above. |
|
|
|
| 8 | |
How many years would be lost in a three year moving average for an annual time series? |
| | A) | 2 at the start and 1 at the end. |
| | B) | 1 at the start and 1 at the end. |
| | C) | 2 at the start and 0 at the end. |
| | D) | 0 at the start and 2 at the end. |
|
|
|
| 9 | |
How will data that increases or decreases by equal percents appear when plotted on an arithmetic scale? |
| | A) | straight line |
| | B) | linear |
| | C) | curvilinear |
| | D) | Both a and b are correct |
|
|
|
| 10 | |
A logarithmic trend equation should be used for forecasts when the time series is increasing by: |
| | A) | equal amounts |
| | B) | increasing percents |
| | C) | increasing moving averages |
| | D) | decreasing percents |
|
|