 |
| 1 | |
In a scatter diagram: |
| | A) | the dependent variable is scaled along the horizontal axis. |
| | B) | the independent variable is scaled along the vertical axis. |
| | C) | the graph shows the relationship between two variables. |
| | D) | the probabilities are plotted. |
|
|
|
| 2 | |
A correlation measures the: |
| | A) | relationship between several independent variables. |
| | B) | strength of the association between two variables. |
| | C) | strength of the association between two variances. |
| | D) | strength of the association between two means. |
|
|
|
| 3 | |
The sample correlation coefficient: |
| | A) | has the same sign as the slope of the regression equation. |
| | B) | can range from -1.00 up to 10.00 |
| | C) | is also called Student's t. |
| | D) | has "n" degrees of freedom. |
|
|
|
| 4 | |
The coefficient of determination is: |
| | A) | the square root of the correlation coefficient. |
| | B) | between -1.00 and 1.00. |
| | C) | equal to (1 - (SSE/ SS Total)). |
| | D) | the treatment mean square plus the error mean square. |
|
|
|
| 5 | |
Suppose we developed the following least squares regression equation: 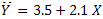 <a onClick="window.open('/olcweb/cgi/pluginpop.cgi?it=jpg::::/sites/dl/free/0073521477/944526/ch13_q5.jpg','popWin', 'width=NaN,height=NaN,resizable,scrollbars');" href="#"><img valign="absmiddle" height="16" width="16" border="0" src="/olcweb/styles/shared/linkicons/image.gif"> (3.0K)</a>. What can we conclude? <a onClick="window.open('/olcweb/cgi/pluginpop.cgi?it=jpg::::/sites/dl/free/0073521477/944526/ch13_q5.jpg','popWin', 'width=NaN,height=NaN,resizable,scrollbars');" href="#"><img valign="absmiddle" height="16" width="16" border="0" src="/olcweb/styles/shared/linkicons/image.gif"> (3.0K)</a>. What can we conclude? |
| | A) | The dependent variable increases 3.5 for each unit increase in X. |
| | B) | The equation crosses the Y-axis at 2.1. |
| | C) | If X = 5, then  <a onClick="window.open('/olcweb/cgi/pluginpop.cgi?it=jpg::::/sites/dl/free/0073521477/944514/ch13_q5_c.jpg','popWin', 'width=NaN,height=NaN,resizable,scrollbars');" href="#"><img valign="absmiddle" height="16" width="16" border="0" src="/olcweb/styles/shared/linkicons/image.gif"> (0.0K)</a> is 14. <a onClick="window.open('/olcweb/cgi/pluginpop.cgi?it=jpg::::/sites/dl/free/0073521477/944514/ch13_q5_c.jpg','popWin', 'width=NaN,height=NaN,resizable,scrollbars');" href="#"><img valign="absmiddle" height="16" width="16" border="0" src="/olcweb/styles/shared/linkicons/image.gif"> (0.0K)</a> is 14. |
| | D) | There is a significant positive relationship between the dependent and independent variables. |
|
|
|
| 6 | |
The standard error of estimate is based on: |
| | A) | squared deviations from the regression line. |
| | B) | negative values. |
| | C) | squared units of the independent variable. |
| | D) | the regression mean square error. |
|
|
|
| 7 | |
Which of the following is not a necessary condition for regression analysis? |
| | A) | The standard deviation of each of the conditional distributions must be the same. |
| | B) | The Y values are independent. |
| | C) | For each X value, there is a group of Y values and these Y values are normally distributed. |
| | D) | The slope of the regression line is positive (increasing). |
|
|
|
| 8 | |
Which of the following statistics is not based on squared deviations from the regression line? |
| | A) | The correlation coefficient |
| | B) | The coefficient of determination |
| | C) | The residuals |
| | D) | The standard error of estimate |
|
|
|
| 9 | |
In an ANOVA table for simple linear regression, the degrees of freedom for the regression mean square is equal to: |
| | A) | 1. |
| | B) | n - 1. |
| | C) | n - 2. |
| | D) | n. |
|
|
|
| 10 | |
The term (SSR/SS total) is also called the: |
| | A) | sum of squares due to regression. |
| | B) | coefficient of determination. |
| | C) | standard error of estimate. |
| | D) | correlation coefficient. |
|
|
|
| 11 | |
When comparing the 90% confidence and prediction intervals for a given regression analysis: |
| | A) | the confidence interval is wider than a prediction interval. |
| | B) | the confidence interval is narrower than a prediction interval. |
| | C) | there is no difference between confidence and prediction intervals. |
| | D) | None of these. |
|
|
|
| 12 | |
The hypothesis, H0:ρ = 0, is tested using a: |
| | A) | z statistic. |
| | B) | F statistic. |
| | C) | t statistic with n-1 degrees of freedom. |
| | D) | t statistic with n-2 degrees of freedom. |
|
|
|
| 13 | |
If the coefficient of determination is 95%, then: |
| | A) | 95% of the variation in the dependent variable is explained by the independent variable. |
| | B) | 95% of the variation in the independent variable is explained by the dependent variable. |
| | C) | the regression equation is 95% correct. |
| | D) | 95% of the time, the confidence interval is a good estimate. |
|
|