USING SPSS-EXAMPLE AND EXERCISE
If you do not already know how to use SPSS, read and work through Appendix 4 before proceeding with the exercise.
The SPSS FREQUENCIES procedure can be used to produce frequency distributions with percentage and cumulative percentage columns in either an ascending or descending arrangement.Example: We will use SPSS to produce a frequency distribution for Problem 3. The steps are as follows:
- Start SPSS, enter the data, and name the variable reaction.
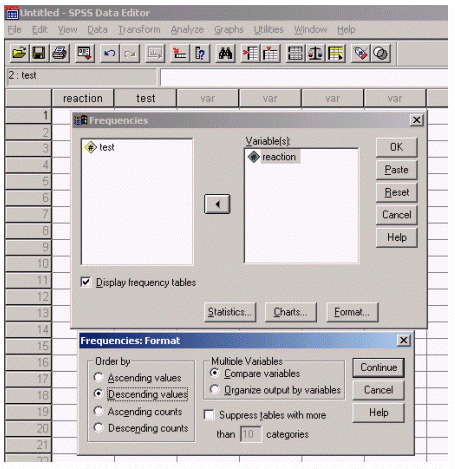
- Click Analyze>Descriptive Statistics>Frequencies.
- Highlight reaction and move it into the Variable(s) box.
- To produce a descending arrangement, click Format>Order by Descending values>Continue. The Frequencies dialog box and the Frequencies: Format dialog box should appear as follows:
 <a onClick="window.open('/olcweb/cgi/pluginpop.cgi?it=gif:: ::/sites/dl/free/0072832517/55312/c3_spss1.gif','popWin', 'width=NaN,height=NaN,resizable,scrollbars');" href="#"><img valign="absmiddle" height="16" width="16" border="0" src="/olcweb/styles/shared/linkicons/image.gif"> (108.0K)</a> <a onClick="window.open('/olcweb/cgi/pluginpop.cgi?it=gif:: ::/sites/dl/free/0072832517/55312/c3_spss1.gif','popWin', 'width=NaN,height=NaN,resizable,scrollbars');" href="#"><img valign="absmiddle" height="16" width="16" border="0" src="/olcweb/styles/shared/linkicons/image.gif"> (108.0K)</a>
- Click OK.
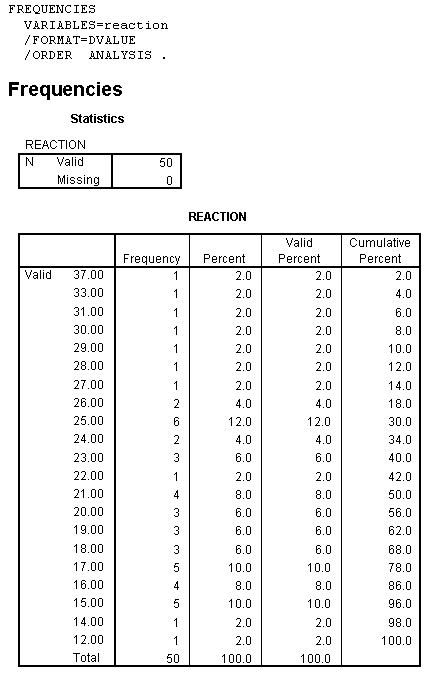
The output showing the complete frequency distribution for Problem 3 should appear as follows. Note: If you are using the student version of SPSS, the syntax (immediately below) may not be available.
 <a onClick="window.open('/olcweb/cgi/pluginpop.cgi?it=gif:: ::/sites/dl/free/0072832517/55312/c3_spss2.gif','popWin', 'width=NaN,height=NaN,resizable,scrollbars');" href="#"><img valign="absmiddle" height="16" width="16" border="0" src="/olcweb/styles/shared/linkicons/image.gif"> (9.0K)</a> <a onClick="window.open('/olcweb/cgi/pluginpop.cgi?it=gif:: ::/sites/dl/free/0072832517/55312/c3_spss2.gif','popWin', 'width=NaN,height=NaN,resizable,scrollbars');" href="#"><img valign="absmiddle" height="16" width="16" border="0" src="/olcweb/styles/shared/linkicons/image.gif"> (9.0K)</a>
Note that the cumulative percentage column accumulates the percentages in ascending rather than descending order, which is the opposite of the way we taught the procedure in the textbook. In fact, it may be better for you to leave the frequency distribution format in ascending order (see step 4), because the cumulative percent column in the output is always ascending. If you do it this way, the SPSS frequency distributions will be perfectly inverted for all columns and will be easier to compare with the text. In a few cases, particularly in this chapter and the next one on graphing, SPSS does not have enough flexibility to produce the output that we described in the textbook. Because SPSS doesn't have the flexibility, we will have to be flexible for it. Exercise Using SPSS - Use the data in the second column (scores from 35 to 23) from Problem 7 to construct a descending frequency distribution using SPSS. Note that you will need to enter each score as many times as indicated by the frequency. For example, 35 would be entered 8 times.
 Click here to view the answers. (30.0K) Click here to view the answers. (30.0K) |


 2003 McGraw-Hill Higher Education
