 |  Statistics for the Behavioral Sciences, 4/e Michael Thorne,
Mississippi State University -- Mississippi State
Martin Giesen,
Mississippi State University -- Mississippi State
Measures of Central Tendency
SPSS ExercisesUSING SPSS-EXAMPLE AND EXERCISE
From now on, we will assume that you have read Appendix 4 on using SPSS.
SPSS has several procedures that can provide measures of central tendency and dispersion. For example, Frequencies, Descriptives, or Explore could be used.Example: We will use SPSS to obtain the three measures of central tendency (mean, median, and mode) using the data in Problem 6. The steps are as follows:
- Start SPSS, enter the data, and name the variable act.
- We will use Frequencies to obtain a frequency distribution and descriptive statistics.
- Click Analyze>Descriptive Statistics>Frequencies.
- Move act into the Variables box.
- Click the Statistics box to open the Frequencies: Statistics dialog box. There click Mean, Median, Mode under Central Tendency, and then click Continue>OK.
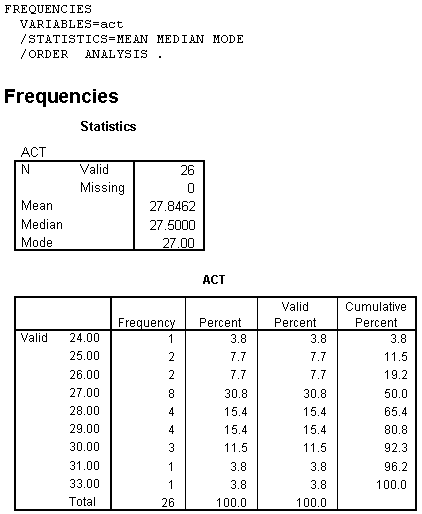
- The statistics and a frequency distribution should appear in the output Viewer window. The output showing the descriptive statistics and frequency distribution for Problem 6 should appear as follows:
 <a onClick="window.open('/olcweb/cgi/pluginpop.cgi?it=gif:: ::/sites/dl/free/0072832517/55314/c5_spss1.gif','popWin', 'width=NaN,height=NaN,resizable,scrollbars');" href="#"><img valign="absmiddle" height="16" width="16" border="0" src="/olcweb/styles/shared/linkicons/image.gif"> (6.0K)</a> <a onClick="window.open('/olcweb/cgi/pluginpop.cgi?it=gif:: ::/sites/dl/free/0072832517/55314/c5_spss1.gif','popWin', 'width=NaN,height=NaN,resizable,scrollbars');" href="#"><img valign="absmiddle" height="16" width="16" border="0" src="/olcweb/styles/shared/linkicons/image.gif"> (6.0K)</a>
Exercise Using SPSS- Using the data in Problem 3, use SPSS to obtain the mean, median, and mode of the scores.
 Click here to view the answers. (30.0K) Click here to view the answers. (30.0K) |
|


 2003 McGraw-Hill Higher Education