USING SPSS—EXAMPLES AND EXERCISES
SPSS has several procedures that can provide measures of central tendency and dispersion. For example,
Frequencies, Descriptives, or Explore can be used. Using a Compute statement, z scores can be calculated,
or they can be obtained "automatically" as an option under the Descriptives procedure.Example: We will use SPSS to obtain the three measures of central tendency (mean, median, and mode),
measures of dispersion (range, variance, and standard deviation), and z scores for all test scores using the
data in Problem 6. The steps are as follows:
- Start SPSS, enter the data, and name the variable test.
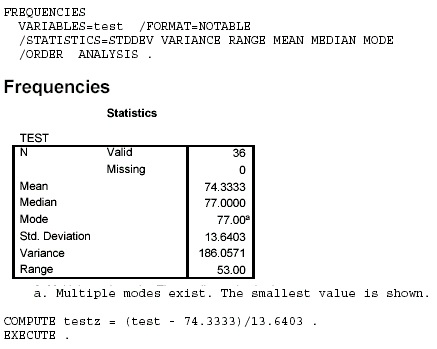
- We will use Frequencies to obtain the measures of central tendency and dispersion.
- Go to Analyze>Descriptive Statistics>Frequencies.
- Move test to the Variables box; uncheck "display frequency table" so the frequency distribution will not be calculated.
- Click Statistics, select the measures of central tendency and dispersion that you want, and then click Continue>OK. This will give the descriptive statistics in the output Viewer window.
- Next we will compute z scores using the Compute procedure. To do this we need to know the mean (symbolized by M = 74.3333 rather than X = 74.3333, as we symbolized it in the text) and standard deviation (s = 13.6403) from the output. The formula for any z score is z = (X – M)/s or z = (X – 74.3333)/13.6403. We will now put this formula in the Compute box.
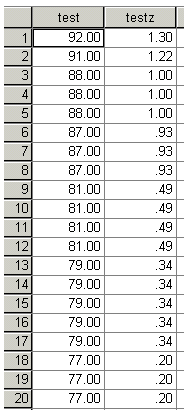
- From the Data Editor window, click Transform>Compute. Then enter "testz" in the Target variable box.
- In the Numeric Expression box, move test in and use the keypad or type and edit so the expression appears as follows: (test – 74.3333)/13.6403.
- Click OK. Check the Data Editor window and find the computed z scores.
Example: Repeat SPSS for the previous example using the Descriptives procedure. Although you will not be able to obtain the median and mode from this procedure, z scores can be computed automatically.
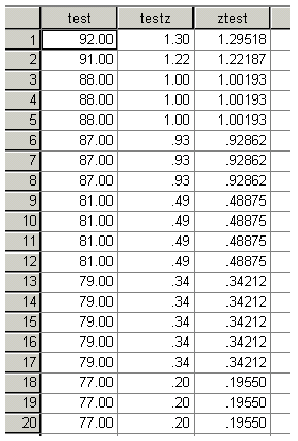
- Click Analyze>Descriptive Statistics> Descriptives, move test into the Variables box, and click "Save standardized values as variables." This causes the z scores to be computed.
- Click Options and select the desired descriptive statistics that are available, then click Continue>OK.
- The output Viewer shows the descriptive statistics. The Data Editor should show another variable ztest showing the z scores again, differing only in the number of decimal places displayed.
 <a onClick="window.open('/olcweb/cgi/pluginpop.cgi?it=gif:: ::/sites/dl/free/0072832517/55315/c6_spss1.gif','popWin', 'width=NaN,height=NaN,resizable,scrollbars');" href="#"><img valign="absmiddle" height="16" width="16" border="0" src="/olcweb/styles/shared/linkicons/image.gif"> (10.0K)</a> <a onClick="window.open('/olcweb/cgi/pluginpop.cgi?it=gif:: ::/sites/dl/free/0072832517/55315/c6_spss1.gif','popWin', 'width=NaN,height=NaN,resizable,scrollbars');" href="#"><img valign="absmiddle" height="16" width="16" border="0" src="/olcweb/styles/shared/linkicons/image.gif"> (10.0K)</a>
 <a onClick="window.open('/olcweb/cgi/pluginpop.cgi?it=gif:: ::/sites/dl/free/0072832517/55315/c6_spss2.gif','popWin', 'width=NaN,height=NaN,resizable,scrollbars');" href="#"><img valign="absmiddle" height="16" width="16" border="0" src="/olcweb/styles/shared/linkicons/image.gif"> (4.0K)</a> <a onClick="window.open('/olcweb/cgi/pluginpop.cgi?it=gif:: ::/sites/dl/free/0072832517/55315/c6_spss2.gif','popWin', 'width=NaN,height=NaN,resizable,scrollbars');" href="#"><img valign="absmiddle" height="16" width="16" border="0" src="/olcweb/styles/shared/linkicons/image.gif"> (4.0K)</a>
SPSS Data Editor window showing z scores obtained using the Compute statement (first 20 cases).
 <a onClick="window.open('/olcweb/cgi/pluginpop.cgi?it=gif:: ::/sites/dl/free/0072832517/55315/c6_spss3.gif','popWin', 'width=NaN,height=NaN,resizable,scrollbars');" href="#"><img valign="absmiddle" height="16" width="16" border="0" src="/olcweb/styles/shared/linkicons/image.gif"> (8.0K)</a> <a onClick="window.open('/olcweb/cgi/pluginpop.cgi?it=gif:: ::/sites/dl/free/0072832517/55315/c6_spss3.gif','popWin', 'width=NaN,height=NaN,resizable,scrollbars');" href="#"><img valign="absmiddle" height="16" width="16" border="0" src="/olcweb/styles/shared/linkicons/image.gif"> (8.0K)</a>
SPSS Data Editor window showing z scores computed using the Compute statement and using the z-score
output option for the Descriptives procedure.
 <a onClick="window.open('/olcweb/cgi/pluginpop.cgi?it=gif:: ::/sites/dl/free/0072832517/55315/c6_spss4.gif','popWin', 'width=NaN,height=NaN,resizable,scrollbars');" href="#"><img valign="absmiddle" height="16" width="16" border="0" src="/olcweb/styles/shared/linkicons/image.gif"> (8.0K)</a> <a onClick="window.open('/olcweb/cgi/pluginpop.cgi?it=gif:: ::/sites/dl/free/0072832517/55315/c6_spss4.gif','popWin', 'width=NaN,height=NaN,resizable,scrollbars');" href="#"><img valign="absmiddle" height="16" width="16" border="0" src="/olcweb/styles/shared/linkicons/image.gif"> (8.0K)</a>
Exercises Using SPSS - Using the data from Problem 2, use the SPSS Descriptives procedure to obtain the mean, standard deviation, variance, and z scores for each score.
- Using the same data and the necessary statistics from the previous exercise, employ the SPSS Compute procedure to calculate z scores again for each score. Use correctz as the target variable name.
 Click here to view the answers. (125.0K) Click here to view the answers. (125.0K)
|


 2003 McGraw-Hill Higher Education


