 |
| 1 |  | 
The primary argument supporting economic growth is that growth: |
|  | A) | reduces spillover costs such as pollution |
|  | B) | reduces the "problem of the commons" |
|  | C) | is the path to higher living standards |
|  | D) | increases job security |
|
|
 |
| 2 |  | 
Which of the following sources of economic growth is a demand-side factor? |
|  | A) | higher spending on rising output |
|  | B) | improved technology |
|  | C) | utilizing resources in the least costly way |
|  | D) | increases in the quantity of human resources |
|
|
 |
| 3 |  | 
Economic growth has caused the relative prices of most basic natural resources to increase. |
|  | A) | True |
|  | B) | False |
|
|
 |
| 4 |  | 
Of the following sources of economic growth, which would cause an outward shift of the economy's production possibilities curve? |
|  | A) | higher spending on rising output |
|  | B) | utilizing resources in the least costly way |
|  | C) | producing the combination of goods and services that achieves allocative efficiency |
|  | D) | improvements in technology |
|
|
 |
| 5 |  | 
Over the past year, suppose an economy's labor productivity decreased by 2% while its total hours of work decreased by 2%. We could conclude this economy's: |
|  | A) | production possibilities curve shifted to the left |
|  | B) | long-run aggregate supply curve shifted to the right |
|  | C) | real GDP remained constant |
|  | D) | capital stock increased by 2% |
|
|
 |
| 6 |  | 
If labor productivity is 25 units of output per hour of work and hours of work totaled 100, real GDP is 2500. |
|  | A) | True |
|  | B) | False |
|
|
 |
| 7 |  | 
Over the past year, suppose an economy's hours of work rose by 4% while labor productivity remained constant. We could conclude that this economy's: |
|  | A) | long-run aggregate supply curve shifted to the left |
|  | B) | real GDP increase by 2% |
|  | C) | total spending increased by 4% |
|  | D) | production possibilities curve shifted outwards |
|
|
 |
| 8 |  | 
Over the past year, suppose an economy's hours of work have increased by 1% and its labor productivity has increased by 3%. We could conclude that this economy's real GDP has increased by about: |
|  | A) | .03% |
|  | B) | 2% |
|  | C) | 3% |
|  | D) | 4% |
|
|
 |
| 9 |  | 
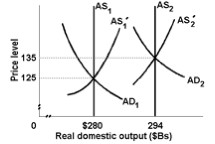
Use the following diagram to answer the next question.
 <a onClick="window.open('/olcweb/cgi/pluginpop.cgi?it=jpg::::/sites/dl/free/0073273082/384258/quiz16b_9.jpg','popWin', 'width=NaN,height=NaN,resizable,scrollbars');" href="#"><img valign="absmiddle" height="16" width="16" border="0" src="/olcweb/styles/shared/linkicons/image.gif"> (7.0K)</a> <a onClick="window.open('/olcweb/cgi/pluginpop.cgi?it=jpg::::/sites/dl/free/0073273082/384258/quiz16b_9.jpg','popWin', 'width=NaN,height=NaN,resizable,scrollbars');" href="#"><img valign="absmiddle" height="16" width="16" border="0" src="/olcweb/styles/shared/linkicons/image.gif"> (7.0K)</a>
Refer to the diagram. Over the past decade, the aggregate supply and aggregate demand curves have shifted outward as shown in the diagram. We can conclude that: |
|  | A) | nominal GDP and real GDP grew at the same rate |
|  | B) | nominal GDP grew at a faster rate than real GDP |
|  | C) | real GDP grew at a faster rate than nominal GDP |
|  | D) | although nominal GDP increased, real GDP decreased |
|
|
 |
| 10 |  | 
If aggregate demand increases at a faster rate than long-run aggregate supply: |
|  | A) | the economy will enter a recession |
|  | B) | the production possibilities curve will shift to the left |
|  | C) | there will be upward pressure on the price level |
|  | D) | the Fed will be tempted to lower interest rates |
|
|

