 |
| 1 |  | 
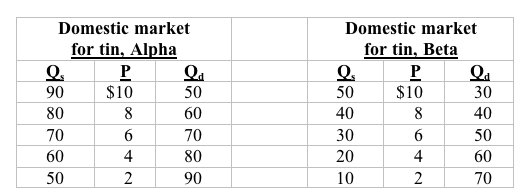
Answer the next question on the basis of the following data for the hypothetical nations of Alpha and Beta. Qs and Qd are domestic quantities supplied and demanded, respectively.
 <a onClick="window.open('/olcweb/cgi/pluginpop.cgi?it=jpg::::/sites/dl/free/0073273082/384260/quiz35a_1.jpg','popWin', 'width=NaN,height=NaN,resizable,scrollbars');" href="#"><img valign="absmiddle" height="16" width="16" border="0" src="/olcweb/styles/shared/linkicons/image.gif"> (23.0K)</a> <a onClick="window.open('/olcweb/cgi/pluginpop.cgi?it=jpg::::/sites/dl/free/0073273082/384260/quiz35a_1.jpg','popWin', 'width=NaN,height=NaN,resizable,scrollbars');" href="#"><img valign="absmiddle" height="16" width="16" border="0" src="/olcweb/styles/shared/linkicons/image.gif"> (23.0K)</a>
Refer to the above data. At a world price of $8: |
|  | A) | Alpha will want to import 20 units of tin |
|  | B) | Beta will want to export 20 units of tin |
|  | C) | Alpha will want to export 20 units of tin |
|  | D) | Beta will want to import 20 units of tin |
|
|
 |
| 2 |  | 
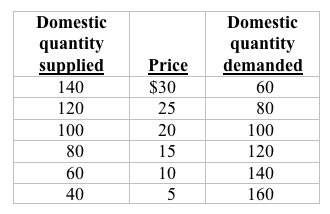
Answer the next question on the basis of the following domestic supply and demand schedules for aluminum for a small country.
 <a onClick="window.open('/olcweb/cgi/pluginpop.cgi?it=jpg::::/sites/dl/free/0073273082/384260/quiz35a_2.jpg','popWin', 'width=NaN,height=NaN,resizable,scrollbars');" href="#"><img valign="absmiddle" height="16" width="16" border="0" src="/olcweb/styles/shared/linkicons/image.gif"> (16.0K)</a> <a onClick="window.open('/olcweb/cgi/pluginpop.cgi?it=jpg::::/sites/dl/free/0073273082/384260/quiz35a_2.jpg','popWin', 'width=NaN,height=NaN,resizable,scrollbars');" href="#"><img valign="absmiddle" height="16" width="16" border="0" src="/olcweb/styles/shared/linkicons/image.gif"> (16.0K)</a>
Refer to the data. Suppose the world price of aluminum is $10. If this country imposes a $5 tariff, the quantities sold in this country by foreign and domestic producers respectively will be: |
|  | A) | 80 units and 40 units |
|  | B) | 100 units and 0 units |
|  | C) | 120 units and 40 units |
|  | D) | 40 units and 120 units |
|
|
 |
| 3 |  | 
Which of the following is an example of a land-intensive commodity? |
|  | A) | chemicals |
|  | B) | machinery |
|  | C) | coffee |
|  | D) | DVD players |
|
|
 |
| 4 |  | 
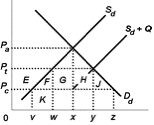
Use the following diagram to answer the next question:
 <a onClick="window.open('/olcweb/cgi/pluginpop.cgi?it=jpg::::/sites/dl/free/0073273082/384260/quiz35a_4.jpg','popWin', 'width=NaN,height=NaN,resizable,scrollbars');" href="#"><img valign="absmiddle" height="16" width="16" border="0" src="/olcweb/styles/shared/linkicons/image.gif"> (2.0K)</a> <a onClick="window.open('/olcweb/cgi/pluginpop.cgi?it=jpg::::/sites/dl/free/0073273082/384260/quiz35a_4.jpg','popWin', 'width=NaN,height=NaN,resizable,scrollbars');" href="#"><img valign="absmiddle" height="16" width="16" border="0" src="/olcweb/styles/shared/linkicons/image.gif"> (2.0K)</a>
Refer to the diagram, wherein Sd and Dd are the domestic supply and demand for a product and Pc is the world price of that product. If the government imposes a quota such that the product supply becomes Sd + Q, then: |
|  | A) | the size of the import quota is vz |
|  | B) | the effect is the same as a tariff equal to PcPa |
|  | C) | domestic consumers decrease consumption from z to x |
|  | D) | domestic producers increase production from v to w |
|
|
 |
| 5 |  | 
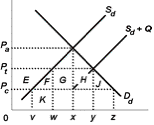
Use the following diagram to answer the next question:
 <a onClick="window.open('/olcweb/cgi/pluginpop.cgi?it=jpg::::/sites/dl/free/0073273082/384260/quiz35a_5.jpg','popWin', 'width=NaN,height=NaN,resizable,scrollbars');" href="#"><img valign="absmiddle" height="16" width="16" border="0" src="/olcweb/styles/shared/linkicons/image.gif"> (2.0K)</a> <a onClick="window.open('/olcweb/cgi/pluginpop.cgi?it=jpg::::/sites/dl/free/0073273082/384260/quiz35a_5.jpg','popWin', 'width=NaN,height=NaN,resizable,scrollbars');" href="#"><img valign="absmiddle" height="16" width="16" border="0" src="/olcweb/styles/shared/linkicons/image.gif"> (2.0K)</a>
Refer to the diagram, wherein Sd and Dd are the domestic supply and demand for a product and Pc is the world price of that product. Sd + Q is the supply curve after an import quota is imposed. A tariff of PcPt will: |
|  | A) | have the same effect on domestic price as the quota. |
|  | B) | generate tax revenue equal to F + G + H + J |
|  | C) | increase domestic consumption from x to y |
|  | D) | increase the revenues of foreign firms |
|
|
 |
| 6 |  | 
The Trade Adjustment Assistance Act of 2002 restricts offshoring by domestic companies. |
|  | A) | True |
|  | B) | False |
|
|
 |
| 7 |  | 
A nation's trading possibilities line: |
|  | A) | lies to the right of its production possibilities line |
|  | B) | lies to the left of its production possibilities line |
|  | C) | coincides with its production possibilities line |
|  | D) | illustrates the decrease in world production associated with specialization and exchange |
|
|
 |
| 8 |  | 
"Tariffs are needed to protect workers from ruinous competition from low-wage countries." This statement: |
|  | A) | is correct because trade is based on absolute advantage, not comparative advantage |
|  | B) | is faulty because comparative advantage makes trade mutually beneficial |
|  | C) | is correct because trade lowers domestic labor productivity and living standards |
|  | D) | is faulty because wage rates and labor productivity are inversely related |
|
|
 |
| 9 |  | 
Answer the next question based on the following diagram:
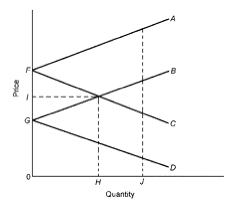 <a onClick="window.open('/olcweb/cgi/pluginpop.cgi?it=jpg::::/sites/dl/free/0073273082/384260/quiz35a_9.jpg','popWin', 'width=NaN,height=NaN,resizable,scrollbars');" href="#"><img valign="absmiddle" height="16" width="16" border="0" src="/olcweb/styles/shared/linkicons/image.gif"> (3.0K)</a> <a onClick="window.open('/olcweb/cgi/pluginpop.cgi?it=jpg::::/sites/dl/free/0073273082/384260/quiz35a_9.jpg','popWin', 'width=NaN,height=NaN,resizable,scrollbars');" href="#"><img valign="absmiddle" height="16" width="16" border="0" src="/olcweb/styles/shared/linkicons/image.gif"> (3.0K)</a>
Refer to the diagram, wherein FA and GB represent the export supply curves of countries Fitzroy and Gilroy, respectively. Which of the following is a true statement? |
|  | A) | In the absence of international trade, the equilibrium price in Fitzroy is I |
|  | B) | In the absence of international trade, the equilibrium price in Gilroy is G |
|  | C) | H represents the equilibrium total amount of the product consumed in both Fitzroy and Gilroy |
|  | D) | In equilibrium, Fitzroy will export the quantity H to Gilroy |
|
|
 |
| 10 |  | 
Answer the next question based on the following diagram:
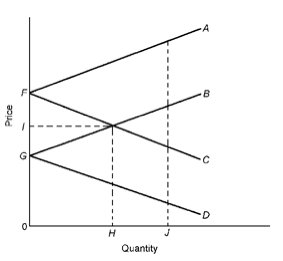 <a onClick="window.open('/olcweb/cgi/pluginpop.cgi?it=jpg::::/sites/dl/free/0073273082/384260/quiz35a_10.jpg','popWin', 'width=NaN,height=NaN,resizable,scrollbars');" href="#"><img valign="absmiddle" height="16" width="16" border="0" src="/olcweb/styles/shared/linkicons/image.gif"> (0.0K)</a> <a onClick="window.open('/olcweb/cgi/pluginpop.cgi?it=jpg::::/sites/dl/free/0073273082/384260/quiz35a_10.jpg','popWin', 'width=NaN,height=NaN,resizable,scrollbars');" href="#"><img valign="absmiddle" height="16" width="16" border="0" src="/olcweb/styles/shared/linkicons/image.gif"> (0.0K)</a>
Refer to the diagram, wherein FA and GB represent the export supply curves of countries Fitzroy and Gilroy, respectively. An increase in the domestic demand for this product in Fitzroy will: |
|  | A) | shift both Fitzroy's export supply and import demand curves upward, and raise the equilibrium world price. |
|  | B) | shift Fitzroy's export supply curve downward and its import demand curve upward, and raise the equilibrium world price |
|  | C) | shift both Fitzroy's export supply and import demand curves downward, and lower the equilibrium world price |
|  | D) | shift both Gilroy's export supply and import demand curves downward, and lower the equilibrium world price |
|
|

