(See related pages)
1. Describe wage determination in a labor market in which workers are unorganized and many firms actively compete for the services of labor. Show this situation graphically, using W1 to indicate the equilibrium wage rate and Q1 to show the number of workers hired by the firms as a group. Show the labor supply curve of the individual firm, and compare it with that of the total market. Why the differences? In the diagram representing the firm, identify total revenue, total wage cost, and revenue available for the payment of nonlabor resources.
2. Complete the following labor supply table for a firm hiring labor competitively. 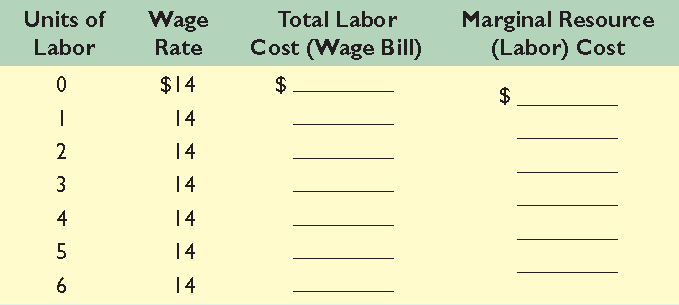
3. Assume a firm is a monopsonist that can hire its first worker for $6 but must increase the wage rate by $3 to attract each successive worker. Draw the firm's labor supply and marginal resource cost curves and explain their relationships to one another. On the same graph, plot the labor demand data of question 2 in Chapter 25. What are the equilibrium wage rate and level of employment? What will be the equilibrium wage rate and the level of employment? Why do these differ from your answer to question 4? 4. Assume a monopsonistic employer is paying a wage rate of Wm and hiring Qm workers, as indicated in Figure 26.8. Now suppose that an industrial union is formed and that it forces the employer to accept a wage rate of Wc. Explain verbally and graphically why in this instance the higher wage rate will be accompanied by an increase in the number of workers hired. |