Problems 1-3 are related to the graph shown in 13-1 and to each other. Consider the MC to be 40 where it is needed.
 |
| 1 | |
In the graph of a Cournot duopolist below, firm 2 assumes firm 1 will produce Q1 output. The demand curve for firm 2 will be <a onClick="window.open('/olcweb/cgi/pluginpop.cgi?it=jpg::::/sites/dl/free/0073375942/236468/chap13_1.jpg','popWin', 'width=NaN,height=NaN,resizable,scrollbars');" href="#"><img valign="absmiddle" height="16" width="16" border="0" src="/olcweb/styles/shared/linkicons/image.gif"> (2.0K)</a> <a onClick="window.open('/olcweb/cgi/pluginpop.cgi?it=jpg::::/sites/dl/free/0073375942/236468/chap13_1.jpg','popWin', 'width=NaN,height=NaN,resizable,scrollbars');" href="#"><img valign="absmiddle" height="16" width="16" border="0" src="/olcweb/styles/shared/linkicons/image.gif"> (2.0K)</a>
|
| | A) | P = 100 – Q2 |
| | B) | P = Q1 – Q2 |
| | C) | P = (100 + Q1) – Q2 |
| | D) | P = (100 – Q1) – Q2 |
|
|
|
| 2 | |
When the demand curve for firm 2 is determined, the reaction curve for firm 2 can be derived by |
| | A) | setting the demand = MC and solving for Q2. |
| | B) | solving demand for Q2. |
| | C) | finding the MR function, setting it equal to MC and solving for Q2. |
| | D) | a process different from any described above. |
|
|
|
| 3 | |
If the reaction curve for firm 2 turns out to be Q2 = 30 – .5Q1, then the Cournot equilibrium output will have each firm producing |
| | A) | 10 |
| | B) | 20 |
| | C) | 30 |
| | D) | 40 |
| | E) | 50 |
|
|
|
| 4 | |
The Bertrand model assumes that the opponent's _______ will not change. The outcome of the model results in an equilibrium output that is the same as the __________. |
| | A) | quantity: single price monopoly |
| | B) | price: perfect competition |
| | C) | quantity: perfect competition |
| | D) | price: single price monopoly |
| | E) | reaction curve: Cournot |
|
|
|
| 5 | |
In the Stackelberg model the Stackelberg leader assumes it knows |
| | A) | the opponents reaction curve. |
| | B) | Its own marginal cost curve. |
| | C) | The demand curve it faces. |
| | D) | All of the above. |
|
|
|
| 6 | |
 <a onClick="window.open('/olcweb/cgi/pluginpop.cgi?it=jpg::::/sites/dl/free/0073375942/236468/chap13_2.jpg','popWin', 'width=NaN,height=NaN,resizable,scrollbars');" href="#"><img valign="absmiddle" height="16" width="16" border="0" src="/olcweb/styles/shared/linkicons/image.gif"> (3.0K)</a> <a onClick="window.open('/olcweb/cgi/pluginpop.cgi?it=jpg::::/sites/dl/free/0073375942/236468/chap13_2.jpg','popWin', 'width=NaN,height=NaN,resizable,scrollbars');" href="#"><img valign="absmiddle" height="16" width="16" border="0" src="/olcweb/styles/shared/linkicons/image.gif"> (3.0K)</a>
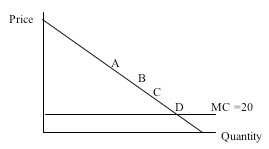
In the graph above four points representing price and quantity are shown. The MC is shown as 20. If the outcomes of the four oligopoly models (Cournot, Bertrand, Stackelberg, and Shared Monopoly) were located on the demand curve in their positions relative to each other with respect to quantity and price, the match-ups would be |
| | A) | A = shared monopoly, B = Cournot, C = Stackelberg, D = Bertrand |
| | B) | A = Bertrand, B = Stackelberg, C = Cournot, D = shared monopoly |
| | C) | A = Cournot, B = Bertrand, C = Stackelberg, D = shared monopoly |
| | D) | A = shared monopoly, B = Stackelberg, C = Cournot, D = Bertrand |
|
|
|
| 7 | |
In a prisoner's dilemma with prisoners A and B, if they both confess, A gets 5 years and B gets 8 years. If both remain silent, A gets 2 years and B goes free. If one confesses and the other does not, the one who confesses gets 1 year and the other gets 15 years. Which statement is true of this case? |
| | A) | There is a dominant strategy for both A and B. |
| | B) | There is no dominant strategy for either A or B. |
| | C) | There is a dominant strategy for A but not for B. |
| | D) | There is a dominant strategy for B but not for A. |
|
|
|
| 8 | |
In baseball games if a pitcher appears to have thrown at an opposing batter it is generally understood that someone on that pitcher's team will be thrown at later in the game. Sometimes bench clearing brawls result, but these incidents happen relatively infrequently over a season. Once each team has made its point the incident is usually forgetten. All of this seems to fit with the oligopoly strategy called |
| | A) | Cournot duopoly strategy |
| | B) | Prisoner dilemma dominant strategy |
| | C) | Tit for tat strategy |
| | D) | Contestable market strategy |
| | E) | Strategic entry deterrence. |
|
|
|
| 9 | |
Monopolistic competition is different from perfect competition in that monopolistic competition does not assume |
| | A) | many buyers and many sellers. |
| | B) | a homogeneous product. |
| | C) | Low cost or free information. |
| | D) | Ease of entry and exit. |
|
|
|
| 10 | |
Monopolistic competitive firms must decide how much to differentiate their product from similar products. Suppose your college is trying to decide how many academic majors it should offer its constituency. The two costs it must consider are shown in the graph below.  <a onClick="window.open('/olcweb/cgi/pluginpop.cgi?it=jpg::::/sites/dl/free/0073375942/236468/chap13_3.jpg','popWin', 'width=NaN,height=NaN,resizable,scrollbars');" href="#"><img valign="absmiddle" height="16" width="16" border="0" src="/olcweb/styles/shared/linkicons/image.gif"> (8.0K)</a> <a onClick="window.open('/olcweb/cgi/pluginpop.cgi?it=jpg::::/sites/dl/free/0073375942/236468/chap13_3.jpg','popWin', 'width=NaN,height=NaN,resizable,scrollbars');" href="#"><img valign="absmiddle" height="16" width="16" border="0" src="/olcweb/styles/shared/linkicons/image.gif"> (8.0K)</a>
To find the optimal number of majors, given these cost functions, your school administrators should |
| | A) | horizontally sum the costs and minimize the result. |
| | B) | Offer the number of majors represented by the point where the 2 costs intersect. |
| | C) | Vertically sum the costs and minimize the resulting total costs. |
| | D) | Find the point where the rate of decline of one cost equals the rate of increase of the other cost. (i.e. where the slopes of the two functions are equal. |
| | E) | Do either c or d since they both amount to the same thing. |
|
|
|
| 11 | |
The Frank text developed a model for determining the optimal number of restaurants that should be built around a lake. To work with the model one needs to know the average distance traveled by each citizen. If the lake is 10 miles in circumference and the people are evenly distributed around the lake, what is the average distance traveled to and from a restaurant if there are 4 restaurants? |
| | A) | 1.25 miles |
| | B) | 2.5 miles |
| | C) | .625 miles |
| | D) | 5 miles |
|
|
|
| 12 | |
Author Frank argues that the consumer preference driven market sequence is a more accurate description of the way markets work than the producer advertiser led market sequence of John K. Galbraith because |
| | A) | advertising is usually ignored by an increasingly well educated public. |
| | B) | producers use advertising to unload items already produced that failed to sell on their own merits. |
| | C) | advertising efforts cancel each other and as such help neither consumer nor producer. |
| | D) | producers advertise most heavily the products that consumers already have expressed a preference for or what producers believe consumers want so the advertising does not revise the sequence of the market signals. |
|
|
The following three questions relate to the table below. The issue for Boeing and Airbus is whether or not to build a new super jumbo jet that can transport 500 people. The numbers in the boxes represent profits that the firms earn under the four different scenarios proposed.
Refer to the graph below for the next 2 problems.