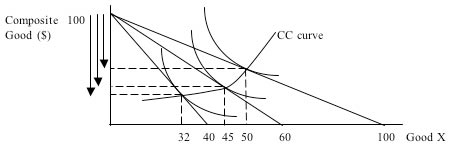
The first 3 questions relate to the graph below.
 |
| 1 | |
 <a onClick="window.open('/olcweb/cgi/pluginpop.cgi?it=jpg::::/sites/dl/free/0073375942/236468/chap04_1.jpg','popWin', 'width=NaN,height=NaN,resizable,scrollbars');" href="#"><img valign="absmiddle" height="16" width="16" border="0" src="/olcweb/styles/shared/linkicons/image.gif"> (10.0K)</a> <a onClick="window.open('/olcweb/cgi/pluginpop.cgi?it=jpg::::/sites/dl/free/0073375942/236468/chap04_1.jpg','popWin', 'width=NaN,height=NaN,resizable,scrollbars');" href="#"><img valign="absmiddle" height="16" width="16" border="0" src="/olcweb/styles/shared/linkicons/image.gif"> (10.0K)</a>
The arrows shown on the graph above depict |
| | A) | changes in the price level of X. |
| | B) | the amount of resources given up in order to acquire good X as the price of X falls. |
| | C) | the amount of income spent on good X as nominal income rises. |
| | D) | the drop in the price of good Y. |
|
|
|
| 2 | |
Which price and quantity coordinate is not on the demand curve derived from the graph above? |
| | A) | price = 1, quantity = 50 |
| | B) | price = 1.67, quantity = 45 |
| | C) | price = 2.5, quantity = 32 |
| | D) | price = 2, quantity = 50 |
|
|
|
| 3 | |
Which is true of a demand curve constructed from the graph above? |
| | A) | Nominal income is held constant over the range of the demand curve. |
| | B) | Real income is held constant over the range of the demand curve. |
| | C) | The price of good Y is held constant as the price of X is varied. |
| | D) | Both a and c are true. |
| | E) | None of the above are true. |
|
|
|
| 4 | |
An income consumption curve shows what happens to the consumer's consumption of good X as nominal income increases and |
| | A) | the price of X falls. |
| | B) | the prices of X and Y stay constant. |
| | C) | the price of Y falls. |
| | D) | real income stays constant. |
|
|
|
| 5 | |
If you were selling a product in a setting where incomes were rapidly rising, which of the 4 Engel curve slopes listed below would you prefer for your product? |
| | A) | –2 |
| | B) | –10 |
| | C) | +2 |
| | D) | +10 |
|
|
The graph below relates to questions 6 and 7.
Questions 13-16 relate to the following graph.
|
| 13 | |
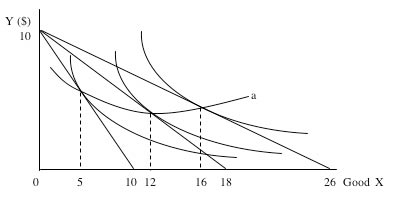 <a onClick="window.open('/olcweb/cgi/pluginpop.cgi?it=jpg::::/sites/dl/free/0073375942/236468/chap04_3.jpg','popWin', 'width=NaN,height=NaN,resizable,scrollbars');" href="#"><img valign="absmiddle" height="16" width="16" border="0" src="/olcweb/styles/shared/linkicons/image.gif"> (9.0K)</a> <a onClick="window.open('/olcweb/cgi/pluginpop.cgi?it=jpg::::/sites/dl/free/0073375942/236468/chap04_3.jpg','popWin', 'width=NaN,height=NaN,resizable,scrollbars');" href="#"><img valign="absmiddle" height="16" width="16" border="0" src="/olcweb/styles/shared/linkicons/image.gif"> (9.0K)</a>
What is the total income of the person depicted in the graph above. |
| | A) | 26 |
| | B) | 18 |
| | C) | 16 |
| | D) | 10 |
| | E) | None of the above. |
|
|
|
| 14 | |
The curve labeled (a) is a(an) |
| | A) | income consumption curve. |
| | B) | price consumption curve |
| | C) | demand curve. |
| | D) | Engel curve |
|
|
|
| 15 | |
Which is not a (price, quantity) coordinate point on the demand curve that is derived from the indifference curves and budget lines in the graph? |
| | A) | $0.39, 16 |
| | B) | $0.56, 12 |
| | C) | $1.00, 5 |
| | D) | $0.81, 10 |
|
|
|
| 16 | |
Which statement is true of the graph above? |
| | A) | The demand curve taken from the graph would be a market demand curve.. |
| | B) | A demand curve taken from the graph would have a constant elasticity throughout the range shown. |
| | C) | In going from the highest price shown to the second highest price, the consumer ends up spending more total dollars on good X than before even though the price fell. |
| | D) | None of the above are true. |
|
|
The graph below relates to questions 17 and 19.
|
| 17 | |
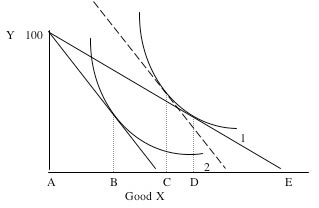 <a onClick="window.open('/olcweb/cgi/pluginpop.cgi?it=jpg::::/sites/dl/free/0073375942/236468/chap04_4.jpg','popWin', 'width=NaN,height=NaN,resizable,scrollbars');" href="#"><img valign="absmiddle" height="16" width="16" border="0" src="/olcweb/styles/shared/linkicons/image.gif"> (7.0K)</a> <a onClick="window.open('/olcweb/cgi/pluginpop.cgi?it=jpg::::/sites/dl/free/0073375942/236468/chap04_4.jpg','popWin', 'width=NaN,height=NaN,resizable,scrollbars');" href="#"><img valign="absmiddle" height="16" width="16" border="0" src="/olcweb/styles/shared/linkicons/image.gif"> (7.0K)</a>
From the graph above we know that good X is a normal good because as the price of X rises and real income decreases, the quantity of X changes from _____ which is the income effect of the price change and that effect indicates that the good is normal. |
| | A) | D to B. |
| | B) | C to B. |
| | C) | D to E. |
| | D) | C to D. |
| | E) | B to E. |
|
|
|
| 18 | |
The substitution effect |
| | A) | is measured by observing movement around the original indifference curve labeled 2. |
| | B) | is measured on the graph above by the distance DC. |
| | C) | is always inversely related to the price change of the good. |
| | D) | conceptually holds real income constant so that the price effect alone is measured. |
| | E) | is described, in part, by all of the above. |
|
|
|
| 19 | |
If one was plotting a demand curve from the graph above, which letters would represent the appropriate quantities for the two prices. |
| | A) | B and C |
| | B) | B and D |
| | C) | D and C |
| | D) | None of the above. Only one relevant point is shown. |
|
|
|
| 20 | |
In order to derive a market demand curve from individual demand curves it is necessary to |
| | A) | vertically sum the individual demand curves. |
| | B) | add the two demand curve as they are given. For example if P = 10 – Q for two individuals, then the market demand would be P = 20 – 2Q. |
| | C) | add the intercept values together, but the slope of the market demand will be the average of the individual demand slopes. |
| | D) | horizontally sum the individual demand curves. |
| | E) | More than one answer is correct for this problem |
|
|
|
| 21 | |
If the slope of a demand curve for good X is constant, then the price elasticity of the good |
| | A) | Increases as the price falls. |
| | B) | Decreases as the price falls. |
| | C) | Has a constant elasticity. |
| | D) | Increases up to the midpoint of the demand curve and then begins to decrease. |
|
|
|
| 22 | |
Which of the following is not true about the determinants of elasticity? |
| | A) | If there are many substitutes for a good, the elasticity of that good will be higher than would otherwise be true. |
| | B) | Cars would tend to have more elastic demand curves than would toothpaste. |
| | C) | The longer the time period the more elastic the demand curve. |
| | D) | A normal good will tend to have a lower price elasticity than an inferior good. |
|
|
|
| 23 | |
If you were in the spring water business and had a self-service spring at which people could get water, what price would you charge if you knew that everyone was honest and would pay? (In other words, assume you have zero costs.) |
| | A) | some price on the elastic portion of the demand . |
| | B) | some price on the inelastic portion of the demand. |
| | C) | the price at the unitary point on the demand curve. |
| | D) | the highest price at which anyone would pay. |
|
|
|
| 24 | |
If the government taxed the rich and gave the revenue to the poor it is likely that |
| | A) | the market demand for hamburger would shift to the right if hamburger is an inferior good. |
| | B) | the market for Mercedes cars would shift right. |
| | C) | the overall market demand for hamburgers and Mercedes would not be effected since total income remains the same in the society. |
| | D) | none of the above would happen because the markets for hamburger and Mercedes would both shift to the left. |
|
|