![](/olcweb/styles/shared/spacer.gif) |
1 | ![](/olcweb/styles/shared/spacer.gif) | ![](/olcweb/styles/shared/spacer.gif) If consumption and disposable income are equal at a particular level of income: |
| ![](/olcweb/styles/shared/spacer.gif) | A)![](/olcweb/styles/shared/spacer.gif) | the MPC must be one at this point. |
| ![](/olcweb/styles/shared/spacer.gif) | B)![](/olcweb/styles/shared/spacer.gif) | the MPS must be zero at this point. |
| ![](/olcweb/styles/shared/spacer.gif) | C)![](/olcweb/styles/shared/spacer.gif) | the APC must be less than one at this point. |
| ![](/olcweb/styles/shared/spacer.gif) | D)![](/olcweb/styles/shared/spacer.gif) | saving must be zero at this point. |
|
|
![](/olcweb/styles/shared/spacer.gif) |
2 | ![](/olcweb/styles/shared/spacer.gif) | ![](/olcweb/styles/shared/spacer.gif) Suppose that for the entire economy, no investment projects will yield an expected real return of more than 12%. However, $10 billion worth of projects will yield expected real returns of 9.1% to 12%, an additional $10 billion will yield expected real returns of 6.1% to 9%, an additional $10 billion will yield expected real returns of 3.1% to 6%, and an additional $10 billion will yield expected real returns of 0% to 3%. If the real rate of interest is 6%, desired investment spending will be: |
| ![](/olcweb/styles/shared/spacer.gif) | A)![](/olcweb/styles/shared/spacer.gif) | $0 billion. |
| ![](/olcweb/styles/shared/spacer.gif) | B)![](/olcweb/styles/shared/spacer.gif) | $10 billion. |
| ![](/olcweb/styles/shared/spacer.gif) | C)![](/olcweb/styles/shared/spacer.gif) | $20 billion. |
| ![](/olcweb/styles/shared/spacer.gif) | D)![](/olcweb/styles/shared/spacer.gif) | $30 billion. |
|
|
![](/olcweb/styles/shared/spacer.gif) |
3 | ![](/olcweb/styles/shared/spacer.gif) | ![](/olcweb/styles/shared/spacer.gif) The investment demand curve will shift to the left if: |
| ![](/olcweb/styles/shared/spacer.gif) | A)![](/olcweb/styles/shared/spacer.gif) | the interest rate decreases. |
| ![](/olcweb/styles/shared/spacer.gif) | B)![](/olcweb/styles/shared/spacer.gif) | the interest rate increases. |
| ![](/olcweb/styles/shared/spacer.gif) | C)![](/olcweb/styles/shared/spacer.gif) | expected returns on investment increase. |
| ![](/olcweb/styles/shared/spacer.gif) | D)![](/olcweb/styles/shared/spacer.gif) | business taxes increase. |
|
|
![](/olcweb/styles/shared/spacer.gif) |
4 | ![](/olcweb/styles/shared/spacer.gif) | ![](/olcweb/styles/shared/spacer.gif) 
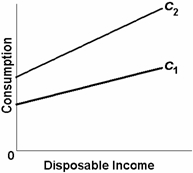
Use the following diagram for this question.
![](/sites/dl/free/0077337727/883755/ch27_q4.jpg) (9.0K)
Which of the following might have caused the shift from consumption schedule C1 to schedule C2? |
| ![](/olcweb/styles/shared/spacer.gif) | A)![](/olcweb/styles/shared/spacer.gif) | An increase in disposable income |
| ![](/olcweb/styles/shared/spacer.gif) | B)![](/olcweb/styles/shared/spacer.gif) | An increase in household wealth |
| ![](/olcweb/styles/shared/spacer.gif) | C)![](/olcweb/styles/shared/spacer.gif) | An increase in household debt |
| ![](/olcweb/styles/shared/spacer.gif) | D)![](/olcweb/styles/shared/spacer.gif) | An increase in taxes |
|
|
![](/olcweb/styles/shared/spacer.gif) |
5 | ![](/olcweb/styles/shared/spacer.gif) | ![](/olcweb/styles/shared/spacer.gif) Suppose the MPC is ¾. If investment spending falls by $10 billion, the level of GDP will: |
| ![](/olcweb/styles/shared/spacer.gif) | A)![](/olcweb/styles/shared/spacer.gif) | fall by $40 billion. |
| ![](/olcweb/styles/shared/spacer.gif) | B)![](/olcweb/styles/shared/spacer.gif) | fall by $30 billion. |
| ![](/olcweb/styles/shared/spacer.gif) | C)![](/olcweb/styles/shared/spacer.gif) | fall by $10 billion. |
| ![](/olcweb/styles/shared/spacer.gif) | D)![](/olcweb/styles/shared/spacer.gif) | fall by $7.5 billion. |
|
|
![](/olcweb/styles/shared/spacer.gif) |
6 | ![](/olcweb/styles/shared/spacer.gif) | ![](/olcweb/styles/shared/spacer.gif) If the slope of the consumption line is .8: |
| ![](/olcweb/styles/shared/spacer.gif) | A)![](/olcweb/styles/shared/spacer.gif) | the MPC is .8. |
| ![](/olcweb/styles/shared/spacer.gif) | B)![](/olcweb/styles/shared/spacer.gif) | the MPS is .8. |
| ![](/olcweb/styles/shared/spacer.gif) | C)![](/olcweb/styles/shared/spacer.gif) | the MPC is 1/.2. |
| ![](/olcweb/styles/shared/spacer.gif) | D)![](/olcweb/styles/shared/spacer.gif) | the MPS is 1/.2. |
|
|
![](/olcweb/styles/shared/spacer.gif) |
7 | ![](/olcweb/styles/shared/spacer.gif) | ![](/olcweb/styles/shared/spacer.gif) If the MPC is .63, the multiplier is: |
| ![](/olcweb/styles/shared/spacer.gif) | A)![](/olcweb/styles/shared/spacer.gif) | 1 / .63. |
| ![](/olcweb/styles/shared/spacer.gif) | B)![](/olcweb/styles/shared/spacer.gif) | 1 – .37. |
| ![](/olcweb/styles/shared/spacer.gif) | C)![](/olcweb/styles/shared/spacer.gif) | 1 / .37. |
| ![](/olcweb/styles/shared/spacer.gif) | D)![](/olcweb/styles/shared/spacer.gif) | .63 / .37. |
|
|
![](/olcweb/styles/shared/spacer.gif) |
8 | ![](/olcweb/styles/shared/spacer.gif) | ![](/olcweb/styles/shared/spacer.gif) All else equal, if the interest rate rises: |
| ![](/olcweb/styles/shared/spacer.gif) | A)![](/olcweb/styles/shared/spacer.gif) | planned investment spending will decrease. |
| ![](/olcweb/styles/shared/spacer.gif) | B)![](/olcweb/styles/shared/spacer.gif) | the investment demand curve will shift upward. |
| ![](/olcweb/styles/shared/spacer.gif) | C)![](/olcweb/styles/shared/spacer.gif) | the investment demand curve will shift to the left. |
| ![](/olcweb/styles/shared/spacer.gif) | D)![](/olcweb/styles/shared/spacer.gif) | the investment demand curve will shift to the right. |
|
|
![](/olcweb/styles/shared/spacer.gif) |
9 | ![](/olcweb/styles/shared/spacer.gif) | ![](/olcweb/styles/shared/spacer.gif) The consumption schedule is: |
| ![](/olcweb/styles/shared/spacer.gif) | A)![](/olcweb/styles/shared/spacer.gif) | an inverse relationship between consumption and the price level. |
| ![](/olcweb/styles/shared/spacer.gif) | B)![](/olcweb/styles/shared/spacer.gif) | a direct relationship between consumption and disposable income. |
| ![](/olcweb/styles/shared/spacer.gif) | C)![](/olcweb/styles/shared/spacer.gif) | an inverse relationship between consumption and saving. |
| ![](/olcweb/styles/shared/spacer.gif) | D)![](/olcweb/styles/shared/spacer.gif) | an inverse relationship between consumption and the tax rate. |
|
|
![](/olcweb/styles/shared/spacer.gif) |
10 | ![](/olcweb/styles/shared/spacer.gif) | ![](/olcweb/styles/shared/spacer.gif) Along a particular saving schedule, each change in disposable income of $15 billion generates an additional $3 billion in saving. Therefore: |
| ![](/olcweb/styles/shared/spacer.gif) | A)![](/olcweb/styles/shared/spacer.gif) | the MPS is .3. |
| ![](/olcweb/styles/shared/spacer.gif) | B)![](/olcweb/styles/shared/spacer.gif) | the MPS is .2. |
| ![](/olcweb/styles/shared/spacer.gif) | C)![](/olcweb/styles/shared/spacer.gif) | the APC is .8. |
| ![](/olcweb/styles/shared/spacer.gif) | D)![](/olcweb/styles/shared/spacer.gif) | the slope of the consumption schedule is .7. |
|
|