Site MapHelpFeedbackVirtual Vista
Virtual Vista
(See related pages)

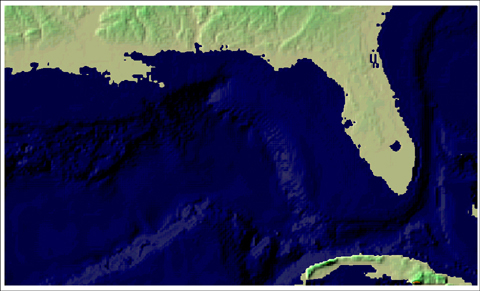
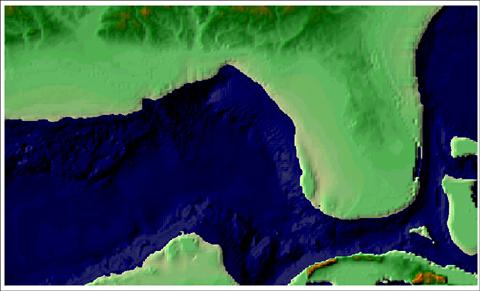
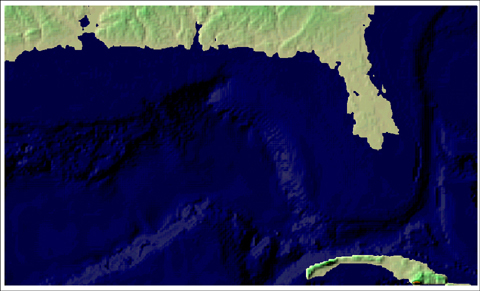
Virtual Vista: Sea-Level Variations, Gulf of Mexico, USA

Geologists are aware that the level of the ocean surface is not fixed, but instead a dynamic feature of our planet. Sea-level during the Last Glacial Maximum (LGM, 20,000 years ago) was 125 - 130 m lower than it is at the present time. The image below shows the modern margin of the Gulf of Mexico.

<a onClick="window.open('/olcweb/cgi/pluginpop.cgi?it=jpg::::/sites/dl/free/0072826967/30425/VirtualVista1401.jpg','popWin', 'width=NaN,height=NaN,resizable,scrollbars');" href="#"><img valign="absmiddle" height="16" width="16" border="0" src="/olcweb/styles/shared/linkicons/image.gif"> (123.0K)</a>

Using digital elevation data, geologists can develop maps showing the continental margins during episodes of lowered sea-level. The image below shows the margin of the Gulf of Mexico and other parts of the western Atlantic (a portion of Cuba and the Bahamas) as they would have appeared 20,000 years ago during the sea-level lowstand. Note that large areas of the continental shelf and the Bahamas platforms are exposed well above sea-level.

<a onClick="window.open('/olcweb/cgi/pluginpop.cgi?it=jpg::::/sites/dl/free/0072826967/30425/VirtualVista1402.jpg','popWin', 'width=NaN,height=NaN,resizable,scrollbars');" href="#"><img valign="absmiddle" height="16" width="16" border="0" src="/olcweb/styles/shared/linkicons/image.gif"> (133.0K)</a>

Geologists can also model sea-level rise using the same types of digital data. In the view below, sea-level is 15 m higher than at present. Note the dramatic change in the outline of the Gulf of Mexico as much of south Florida is inundated. Also note that the Bahamas are completely submerged, and a narrow strip of land is all that remains of Cuba.

<a onClick="window.open('/olcweb/cgi/pluginpop.cgi?it=jpg::::/sites/dl/free/0072826967/30425/VirtualVista1403.jpg','popWin', 'width=NaN,height=NaN,resizable,scrollbars');" href="#"><img valign="absmiddle" height="16" width="16" border="0" src="/olcweb/styles/shared/linkicons/image.gif"> (117.0K)</a>

To learn more about sea-level changes and the geologic processes that shape coastal areas, read chapter 14 of your textbook.

Click on the link below to view a computer animation depicting the rise of sea-level following the last glacial maximum (when sea-level was 125 m lower than today) to the present day and then for sometime in the future when sea-level will be 15 m higher than now.

Sea Level Change (2330.0K)

Points to Ponder

1. What methods have geologists used to determine former sea-levels?

2. The last frame of the Virtual Vista shows sea-level 15 m higher than at present. Discuss some potential impacts (negative and positive) of a catastrophic sea-level rise (transgression) of this magnitude.

Having trouble loading or viewing the video clip? You will need the DivX video codec for your media player to watch the video. The DivX codec is available free from www.divx.com. Click on the link or type the URL into your browser to go to the DivX download site. Once at the DivX site, follow the "DOWNLOAD" links until you locate the download "Standard DivX Codec (FREE)" hyperlink. Click on the link and download the small DivX codec file. The codec file may take a few minutes to load. Please be patient. Once the file is downloaded to your local computer, double click on the file to automatically install the Divx codec.

You may also discover that the Virtual Vistas work best with the Windows Media Player, available as a free download from www.microsoft.com. Click on the link or type the URL into your browser to go to the Microsoft web site. Once at the web site, type "windows media player" into the Search box, then click on the appropriate link to download the latest version of Windows Media Player.


Physical Geo: Earth RevealedOnline Learning Center

Home > Chapter 20 > Virtual Vista