Students collect data from the class and display it using bar graphs, pie charts, line plots, stem and leaf plot, histograms and scatterplots. Scatterplots and trend lines are explored. Just for Fun: M & Ms
Activity Set 7.2 Analyzing Data, Sampling, and Simulation
In this activity set students analyze time intervals between eruptions and duration of eruptions for Old Faithful geyser using stem and leaf plots, line plots, and scatter plots; experimentally select random samples; and use the idea of randomness to simulate a real problem. Just for Fun: Simulated Racing Game
Activity Set 7.3 Statistical Distributions: Observations and Applications
Several frequency distributions will be analyzed including those generated from coin flipping, pulse rates, letter usage in sentences, and leading digits of numbers. Just for Fun: Cryptanalysis
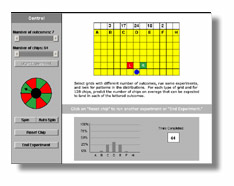
This interactive includes grids and tiles that move randomly across a grid. One challenge is to predict the square at the opposite edge of a grid upon which a tile will most likely land. It is interesting that such random movements when applied to many tiles produce dependable patterns.