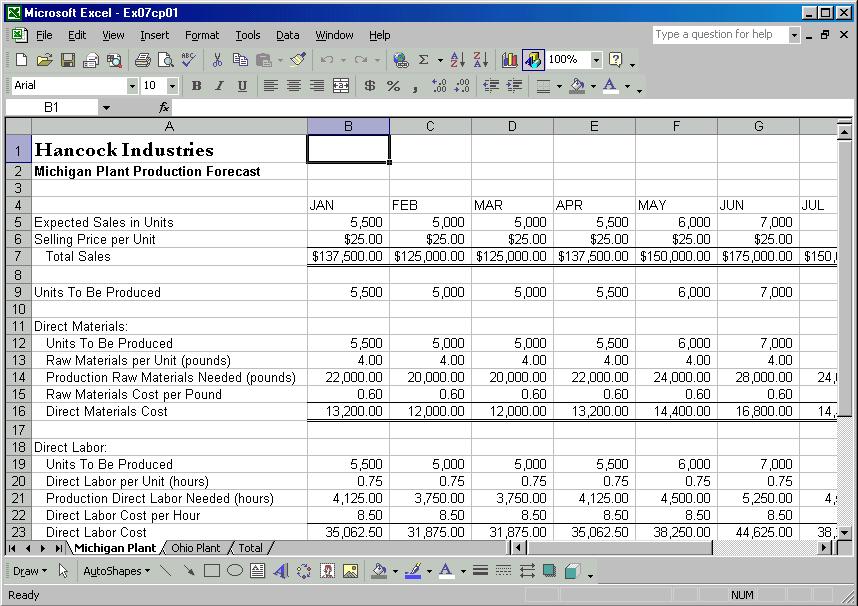
Download as a Word document:  Case Problems Ch07 (419.0K) Case Problems Ch07 (419.0K) Hancock Industries: Production Forecast ConsolidationHancock Industries operates two plants: one in Michigan, the
other in Ohio, each producing a different line of products. Your
task is to format, consolidate, and organize the workbook
contained in the file named "EX07CP01" shown in Figure 7-3. After
opening the file, save it as "Production" to your personal
storage location. To complete the worksheet, perform the
following:  <a onClick="window.open('/olcweb/cgi/pluginpop.cgi?it=jpg:: ::/sites/dl/free/0072470941/26807/Ch07_Image1cp.jpg','popWin', 'width=NaN,height=NaN,resizable,scrollbars');" href="#"><img valign="absmiddle" height="16" width="16" border="0" src="/olcweb/styles/shared/linkicons/image.gif"> (50.0K)</a> <a onClick="window.open('/olcweb/cgi/pluginpop.cgi?it=jpg:: ::/sites/dl/free/0072470941/26807/Ch07_Image1cp.jpg','popWin', 'width=NaN,height=NaN,resizable,scrollbars');" href="#"><img valign="absmiddle" height="16" width="16" border="0" src="/olcweb/styles/shared/linkicons/image.gif"> (50.0K)</a>
Figure 7-3 To make the worksheets easier to work with, freeze panes at B5
in all three worksheets. Start group mode including all three sheets. Format the month column labels (row 4, column B to N) with a
Light Gray fill color, Bold and Italic typeface, and a border of
your choice. When completed correctly, all sheets will have the
same formatting on the column labels. Turn Group mode off. Rename the third sheet "Total" to read "Summary," and position
it as the first sheet in the workbook. Create formulas to consolidate and summarize the data in the
two main worksheets. Be aware that rows that show a value "per
unit" contain data that should be averaged, not summed. Those
rows are: 6, 13, 15, 20, 22, and 27. The rest of the rows should
be summed. Format the cells similar to the cells in the plant
worksheets. (Hint: do the consolidation formulas for the month of
January, and fill across all rows at once.) On the summary sheet, ensure that all columns display properly
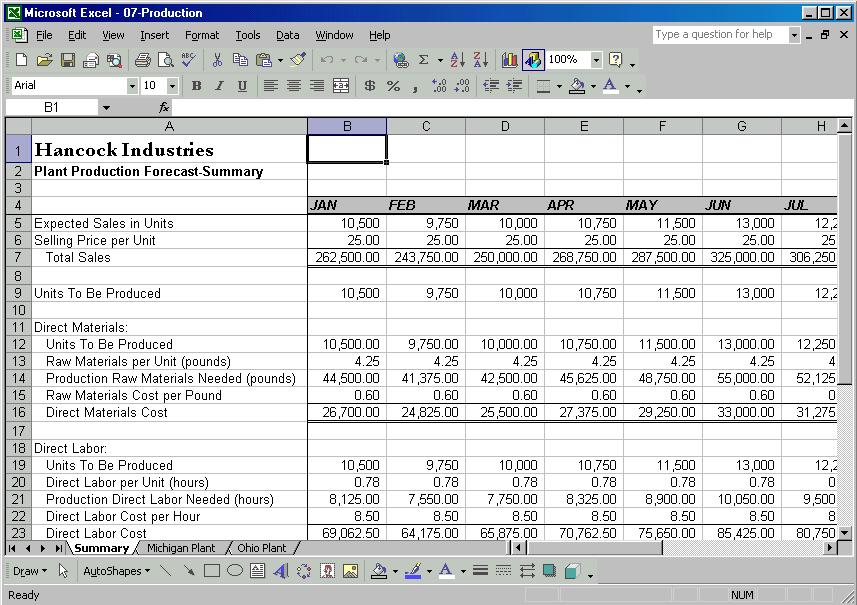
(no cells with ####). Figure 7-4 shows the completed summary
page. When finished save your work. Print the workbook in landscape,
group mode. Make each worksheet to fit a single page wide and a
single page tall. Close the file and exit Excel.  <a onClick="window.open('/olcweb/cgi/pluginpop.cgi?it=jpg:: ::/sites/dl/free/0072470941/26807/Ch07_Image2cp.jpg','popWin', 'width=NaN,height=NaN,resizable,scrollbars');" href="#"><img valign="absmiddle" height="16" width="16" border="0" src="/olcweb/styles/shared/linkicons/image.gif"> (50.0K)</a> <a onClick="window.open('/olcweb/cgi/pluginpop.cgi?it=jpg:: ::/sites/dl/free/0072470941/26807/Ch07_Image2cp.jpg','popWin', 'width=NaN,height=NaN,resizable,scrollbars');" href="#"><img valign="absmiddle" height="16" width="16" border="0" src="/olcweb/styles/shared/linkicons/image.gif"> (50.0K)</a>
Figure 7-4 Data File:  EX07CP01 (27.0K) EX07CP01 (27.0K)
Roscommon Hardware and Gifts
In this exercise you will use the Outline features of Excel to
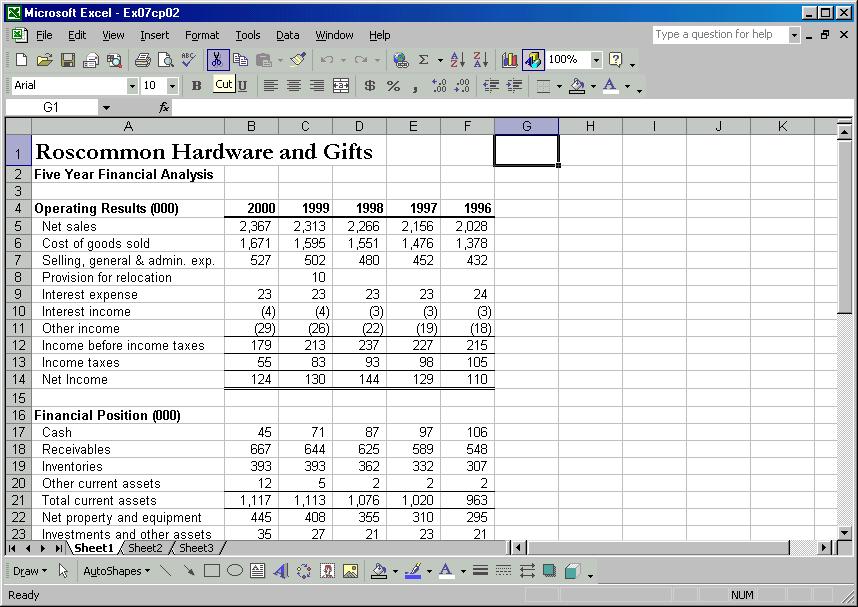
analyze the five-year history of the corporation. (Figure 7-5) To
start open the file EX07CP02 and save it as "Analysis" to your
personal storage location. Move around the worksheet. Where are
there formulas? If you apply outlining, what will be
summarized?  <a onClick="window.open('/olcweb/cgi/pluginpop.cgi?it=jpg:: ::/sites/dl/free/0072470941/26807/Ch07_Image3cp.jpg','popWin', 'width=NaN,height=NaN,resizable,scrollbars');" href="#"><img valign="absmiddle" height="16" width="16" border="0" src="/olcweb/styles/shared/linkicons/image.gif"> (50.0K)</a> <a onClick="window.open('/olcweb/cgi/pluginpop.cgi?it=jpg:: ::/sites/dl/free/0072470941/26807/Ch07_Image3cp.jpg','popWin', 'width=NaN,height=NaN,resizable,scrollbars');" href="#"><img valign="absmiddle" height="16" width="16" border="0" src="/olcweb/styles/shared/linkicons/image.gif"> (50.0K)</a>
Figure 7-5 Perform the following steps: Use the AutoOutline feature to outline and summarize the
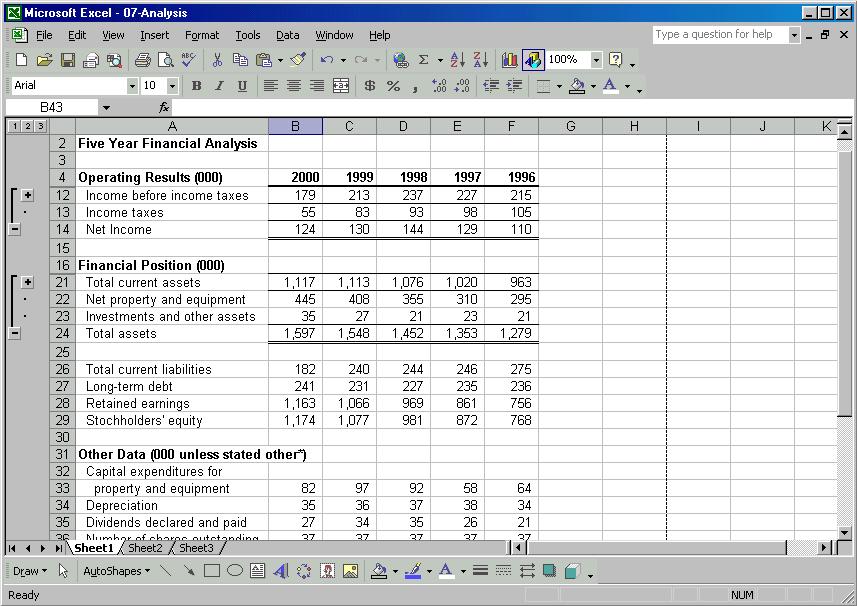
data. Expand and collapse each of the levels. Print the collapsed (showing Level 1 only) worksheet. Expand and print the second level. (Figure 7-6) Save and close the worksheet. Exit Excel.  <a onClick="window.open('/olcweb/cgi/pluginpop.cgi?it=jpg:: ::/sites/dl/free/0072470941/26807/Ch07_Image4cp.jpg','popWin', 'width=NaN,height=NaN,resizable,scrollbars');" href="#"><img valign="absmiddle" height="16" width="16" border="0" src="/olcweb/styles/shared/linkicons/image.gif"> (50.0K)</a> <a onClick="window.open('/olcweb/cgi/pluginpop.cgi?it=jpg:: ::/sites/dl/free/0072470941/26807/Ch07_Image4cp.jpg','popWin', 'width=NaN,height=NaN,resizable,scrollbars');" href="#"><img valign="absmiddle" height="16" width="16" border="0" src="/olcweb/styles/shared/linkicons/image.gif"> (50.0K)</a>
Data File:  EX07CP02 (16.0K) EX07CP02 (16.0K) | 


 2002 McGraw-Hill Higher Education


