(See related pages)
| The Investigation poses questions to generate interest in various mathematical topics from the text and encourages students to formulate and investigate their own conjectures. One use of the investigations is for term papers in which students report on their
conjectures and the patterns they find.
Click on the Read Me file below to open the investigation in a Word file: Graphing Calculator Investigation 7.1Trend Lines The scatter plot below has a trend line which approximates the location of the points of the plot. When the data for this plot are entered into a graphing calculator, the calculator computes the strength of the fit of the line to the points and prints a value r called the correlation coefficient. The closer the value of r to -1 or +1, the stronger the fit.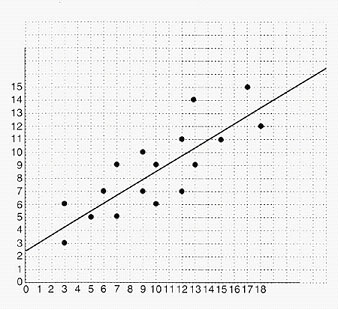 Starting Points for Investigations 1a. What would a set of points look like if the correlation coefficient was close to +1? Predict the correlation coefficient for the trend line in the above graph. ( .5, .6, .7, .8, .9)? Use the statistics functions on a graphing calculator to enter the coordinates of the points of the above plot, and then select the linear regression model, LinReg, to obtain the value of the correlation coefficient. What is this value and how does it compare to your prediction? 1b. The graphing calculator will also print the values of a and b for the linear equation y = a + bx. The equation of the trend line in the above graph is y = 2.6 + .6x, and the statistics functions on a graphing calculator can be used to graph this line over the plot. Experiment by moving points of the plot onto this line and recalculating the correlation coefficient. For example, if the point (13, 14) is moved to (13, 10.4), what is the new value of r? Note that 10.4 is obtained from the equation y = 2.6 + .6x by substituting the value 13 for x. Move another point onto this line, predict the correlation coefficient, and then calculate the new value of r. How many points must be moved to increase the value of r to .9 or greater? Note: You can move the points onto the line whose equation is y = 2.6 + .6x; however, as each point is moved, there will be a slightly different trend line, and you may wish to use this new line. 2. Try to design some scatter plots for which the trend line will have different values of r. For example, try to obtain a trend line for which the value of r is close to zero, or close to -1 or +1. Enter the data for your plots into a graphing calculator, and then move the points around and change the data to vary the value of r. 3. Experiment with some special sets of points. For example, what value of r will be obtained for a scatter plot with just two points? What happens to the value of r as you increase the number of points and select points that are not on the trend line? 4. Experiment by designing sets of points whose curves of best fit are not straight lines. Try some of the regression models on your calculator to obtain the best value of r. For example, what is the curve of best fit for the graphing calculator plot shown below? 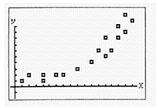 |