The Investigation poses questions to generate interest in various
mathematical topics from the text and encourages students to formulate and investigate their own conjectures. One use of the investigations is for term papers in which students report on their conjectures and the patterns they find.
Click on the Read Me file below to open the investigation in a Word file:
 Read Me - Standard Deviation Instructions (Word Format)
(84.0K) Read Me - Standard Deviation Instructions (Word Format)
(84.0K)
The Math Investigator is a data collection software program that may be used to collect data for the investigation. You may type answers onto the Word file or copy
and paste in data from the Investigator. Click here to launch the Standard Deviation Investigator
Math Investigator 7.2STANDARD DEVIATIONS on the Math Investigator computes and prints the range, mean, and standard deviation for any set of 200 or less data values. It also prints the percent of data within ±1, ±2, and ±3 standard deviations. Starting Points for Investigations- Suppose a teacher grades a set of tests and computes the mean and standard deviation. Because the grades are low, the teacher decides to add 5 points to each test score.
Old Scores: 71, 62, 48, 56, 83, 75, 64, 70, 85, 81, 78, 73
What happens to the range, mean, and standard deviation if each measurement is increased by the same amount? Check your conjecture for some other sets of data.
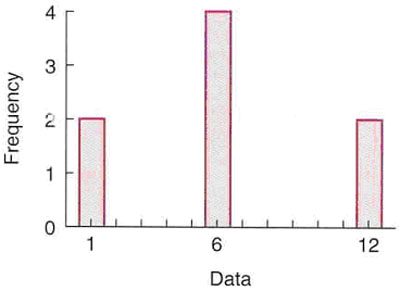
- Experiment with creating strange sets of data to see how many or how few data can occur
within ±1 standard deviation of the mean. What percent of the 8 values (1, 1, 6, 6, 6, 6, 12, 12) illustrated in the graph shown here are within ±1 standard deviation of the mean, and what happens if a large value such as 200 is included in this data?
 <a onClick="window.open('/olcweb/cgi/pluginpop.cgi?it=jpg::::/sites/dl/free/0072532947/78579/7_2.jpg','popWin', 'width=NaN,height=NaN,resizable,scrollbars');" href="#"><img valign="absmiddle" height="16" width="16" border="0" src="/olcweb/styles/shared/linkicons/image.gif"> (25.0K)</a> <a onClick="window.open('/olcweb/cgi/pluginpop.cgi?it=jpg::::/sites/dl/free/0072532947/78579/7_2.jpg','popWin', 'width=NaN,height=NaN,resizable,scrollbars');" href="#"><img valign="absmiddle" height="16" width="16" border="0" src="/olcweb/styles/shared/linkicons/image.gif"> (25.0K)</a>
- Sets A and B have the same range and mean but the data in one of them is more clustered about the mean. Determine their means and standard deviations and form a conjecture about standard deviations as the data becomes more spread out about the mean.
Set A: 17, 70, 71, 71, 72, 73, 73, 74, 77, 77, 89, 98
Set B: 12, 42, 62, 63, 63, 72, 89, 91, 92, 92, 93, 93
Test your conjecture by experimenting with other sets of data which have values clustered about the mean and some which have data spread out from the mean. Support your conclusions with examples.
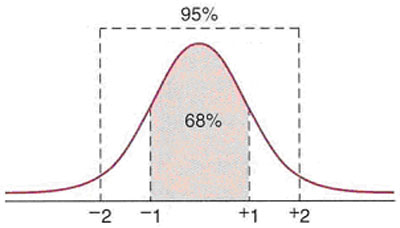
- If the graph of the data is close to a bell-shape or normal curve (see figure below), there will be approximately 68% of the data within ±1 standard deviation of the mean and approximately 95% within ±2 standard deviations of the mean. Experiment with sets of data to try creating a set which approximates these two conditions for standard deviations.
 <a onClick="window.open('/olcweb/cgi/pluginpop.cgi?it=jpg::::/sites/dl/free/0072532947/78579/7_2_2.jpg','popWin', 'width=NaN,height=NaN,resizable,scrollbars');" href="#"><img valign="absmiddle" height="16" width="16" border="0" src="/olcweb/styles/shared/linkicons/image.gif"> (25.0K)</a> <a onClick="window.open('/olcweb/cgi/pluginpop.cgi?it=jpg::::/sites/dl/free/0072532947/78579/7_2_2.jpg','popWin', 'width=NaN,height=NaN,resizable,scrollbars');" href="#"><img valign="absmiddle" height="16" width="16" border="0" src="/olcweb/styles/shared/linkicons/image.gif"> (25.0K)</a>
- In most distributions over 90% of the data are within ±2 standard deviations of the mean. Only very strange distributions have less than 80% (or as little as 75%) in this interval. Try creating a set of data in which less than 80% of the data are within ±2 standard deviations of the mean.
|