USING SPSS—EXAMPLES AND EXERCISES The SPSS procedure for computing t tests has options that will compute both the t test for independent
samples and the t test for dependent samples. Example: First, we will use SPSS to work an exercise for the t test for independent samples—specifically,
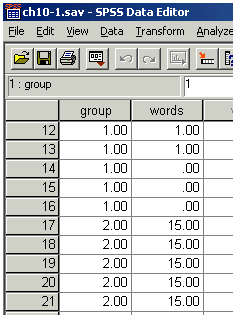
Problem 4. The steps are as follows: - Start SPSS. Data entry is slightly different for this type of problem. Name the first variable group and the second, words. Enter the data for the Recall Test group under words with a 1 in the group column, and enter the data for the Recognition Test group under words but with a 2 in the group column in front of the data. Part of the Data Editor showing the pattern of data entry follows:
 <a onClick="window.open('/olcweb/cgi/pluginpop.cgi?it=gif:: ::/sites/dl/free/0072832517/55319/c10_spss1.gif','popWin', 'width=NaN,height=NaN,resizable,scrollbars');" href="#"><img valign="absmiddle" height="16" width="16" border="0" src="/olcweb/styles/shared/linkicons/image.gif"> (8.0K)</a> <a onClick="window.open('/olcweb/cgi/pluginpop.cgi?it=gif:: ::/sites/dl/free/0072832517/55319/c10_spss1.gif','popWin', 'width=NaN,height=NaN,resizable,scrollbars');" href="#"><img valign="absmiddle" height="16" width="16" border="0" src="/olcweb/styles/shared/linkicons/image.gif"> (8.0K)</a>
- Choose Analyze>Compare Means>Independent Samples T Test.
- Move words into the Test Variables box and group into the Grouping Variable box.
- Click on Define Groups and enter the code values for Group 1 and Group 2. The code values will be 1 and 2 because these are the numbers we entered to identify the groups. Click Continue>OK. The results should appear in the output Viewer window.
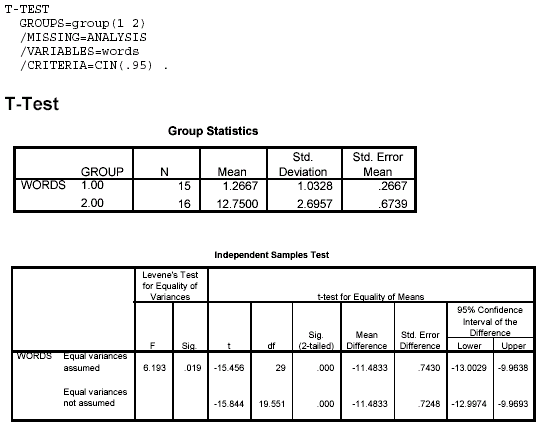
Notes on Reading the Output - The t value we will use is the one in the first row labeled "equal variances assumed," because this is one of the assumptions we have made. (Levene's Test is a test of the homogeneity of variances assumption.)
- "Sig. (2-tailed)" is the exact p value for the computed t. We reject the null hypothesis if this value is ≤ .05 and conclude that there is a significant difference between the groups.
 <a onClick="window.open('/olcweb/cgi/pluginpop.cgi?it=gif:: ::/sites/dl/free/0072832517/55319/c10_spss2.gif','popWin', 'width=NaN,height=NaN,resizable,scrollbars');" href="#"><img valign="absmiddle" height="16" width="16" border="0" src="/olcweb/styles/shared/linkicons/image.gif"> (15.0K)</a> <a onClick="window.open('/olcweb/cgi/pluginpop.cgi?it=gif:: ::/sites/dl/free/0072832517/55319/c10_spss2.gif','popWin', 'width=NaN,height=NaN,resizable,scrollbars');" href="#"><img valign="absmiddle" height="16" width="16" border="0" src="/olcweb/styles/shared/linkicons/image.gif"> (15.0K)</a>
Example: Now we will use SPSS to work an example of the t test for dependent samples—Problem 6. The
steps are as follows:- Start SPSS, name variables neutral and conserv, and enter the data.
- Analyze>Compare Means>Paired-Samples T Test.
- Move both variables into the Paired Variables box, then click OK. The results should appear in the output Viewer window.
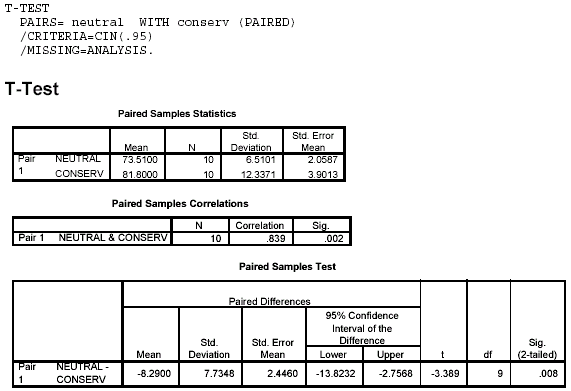
Notes on Reading the Output - You should find the results reasonably easy to identify and interpret in this output. The critical results are found in the Paired Samples Test box. The results indicate that t(9) = –3.389 and p = .008. As before, SPSS labels the p value as "Sig. (2-tailed)." Because the obtained p value is less than our alpha level of .05, we reject the null hypothesis and conclude that there is a significant difference in the heart rates, which increase when a liberal views the slide of a known conservative.
 <a onClick="window.open('/olcweb/cgi/pluginpop.cgi?it=gif:: ::/sites/dl/free/0072832517/55319/c10_spss3.gif','popWin', 'width=NaN,height=NaN,resizable,scrollbars');" href="#"><img valign="absmiddle" height="16" width="16" border="0" src="/olcweb/styles/shared/linkicons/image.gif"> (14.0K)</a> <a onClick="window.open('/olcweb/cgi/pluginpop.cgi?it=gif:: ::/sites/dl/free/0072832517/55319/c10_spss3.gif','popWin', 'width=NaN,height=NaN,resizable,scrollbars');" href="#"><img valign="absmiddle" height="16" width="16" border="0" src="/olcweb/styles/shared/linkicons/image.gif"> (14.0K)</a>
Exercises Using SPSS - Use SPSS to work Self-Test Exercise 6, assuming the data are from independent groups; that is, assume that 20 participants were randomly assigned to attend or not to attend a speed reading course. At the conclusion of the course, all participants were given an evaluation to measure their reading speed in words per minute. Was the class effective? (Hint: Don’t forget the differences in the data input arrangement between the independent and dependent t tests.) Write a conclusion for this problem.
- Use SPSS to work Self-Test Exercise 6 just as stated—as a dependent t test problem. You will have to re-enter your data. Compare your results with those from SPSS Exercise 1. Given the same data, which design is more powerful?
 Click here to view the answers. (99.0K) Click here to view the answers. (99.0K)
|


 2003 McGraw-Hill Higher Education

