 |  Statistics for the Behavioral Sciences, 4/e Michael Thorne,
Mississippi State University -- Mississippi State
Martin Giesen,
Mississippi State University -- Mississippi State
Alternatives to t and F
SPSS ExercisesUSING SPSS-EXAMPLES AND EXERCISES
SPSS provides procedures for computing the Mann-Whitney test, the Wilcoxon test, and the Kruskal-
Wallis test, as well as other types of "nonparametric" techniques. Because the M-W, Wilcoxon, and K-W
tests involve the median as the preferred measure of central tendency and the ranking of data, SPSS
Boxplots provides a useful way to display the results.
Example - Mann-Whitney Test: We will use SPSS to work Problem 6, which is a M-W problem. The
steps are as follows:- Start SPSS, name variables group and risk, and enter the data.
- Select Analyze > Nonparametric Tests > 2-Independent-Samples.
- Move risk into the Test Variable List box, and move group into the Grouping Variable box.
- Define the groups: 1 for Alcohol and 2 for No-Alcohol > Continue.
- In the Test Type box, be sure the Mann-Whitney U is checked - it should be by default. Then click OK and the output should appear in the Viewer window.
- For boxplots of the groups, select Graphs>Boxplot > Simple>Summaries of groups of cases > Define. Move risk into the Variable box and move group into the Category Axis box; then click OK.
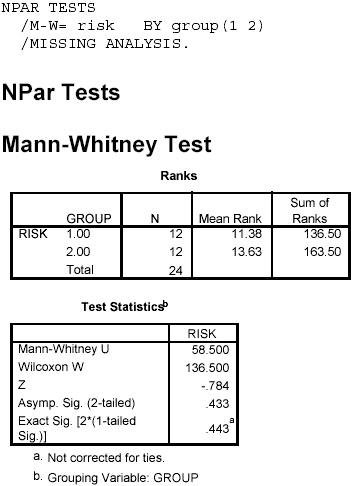
Notes on Reading the Output- You should find the output easy to read and understand. The U value and p value [Asymp. Sig. (2-tailed)] are given in the Test Statistics box.
- The results indicate that there is no significant difference between the two alcohol treatment groups in self-rated risk-taking attitude: U = 58.5, p = .433.
- Examination of the boxplots shows that the groups are similar. The heavy line within the box indicates the position of the median, which is virtually identical for the two groups.
 <a onClick="window.open('/olcweb/cgi/pluginpop.cgi?it=gif:: ::/sites/dl/free/0072832517/55324/c15_spss1.gif','popWin', 'width=NaN,height=NaN,resizable,scrollbars');" href="#"><img valign="absmiddle" height="16" width="16" border="0" src="/olcweb/styles/shared/linkicons/image.gif"> (13.0K)</a> <a onClick="window.open('/olcweb/cgi/pluginpop.cgi?it=gif:: ::/sites/dl/free/0072832517/55324/c15_spss1.gif','popWin', 'width=NaN,height=NaN,resizable,scrollbars');" href="#"><img valign="absmiddle" height="16" width="16" border="0" src="/olcweb/styles/shared/linkicons/image.gif"> (13.0K)</a>  <a onClick="window.open('/olcweb/cgi/pluginpop.cgi?it=gif:: ::/sites/dl/free/0072832517/55324/c15_spss2.gif','popWin', 'width=NaN,height=NaN,resizable,scrollbars');" href="#"><img valign="absmiddle" height="16" width="16" border="0" src="/olcweb/styles/shared/linkicons/image.gif"> (10.0K)</a> <a onClick="window.open('/olcweb/cgi/pluginpop.cgi?it=gif:: ::/sites/dl/free/0072832517/55324/c15_spss2.gif','popWin', 'width=NaN,height=NaN,resizable,scrollbars');" href="#"><img valign="absmiddle" height="16" width="16" border="0" src="/olcweb/styles/shared/linkicons/image.gif"> (10.0K)</a> 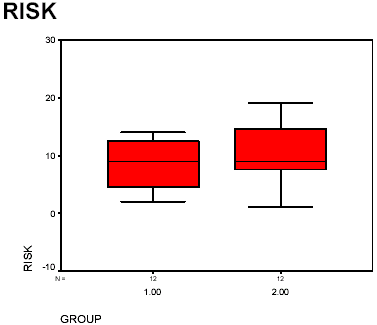 <a onClick="window.open('/olcweb/cgi/pluginpop.cgi?it=gif:: ::/sites/dl/free/0072832517/55324/c15_spss3.gif','popWin', 'width=NaN,height=NaN,resizable,scrollbars');" href="#"><img valign="absmiddle" height="16" width="16" border="0" src="/olcweb/styles/shared/linkicons/image.gif"> (3.0K)</a> Example - Wilcoxon Test: We will use SPSS to work Problem 5. The steps are as follows: <a onClick="window.open('/olcweb/cgi/pluginpop.cgi?it=gif:: ::/sites/dl/free/0072832517/55324/c15_spss3.gif','popWin', 'width=NaN,height=NaN,resizable,scrollbars');" href="#"><img valign="absmiddle" height="16" width="16" border="0" src="/olcweb/styles/shared/linkicons/image.gif"> (3.0K)</a> Example - Wilcoxon Test: We will use SPSS to work Problem 5. The steps are as follows:- Start SPSS and name variables before and after. Enter the data.
- Select Analyze > Nonparametric Tests > 2 Related Samples.
- In the dialog box, move the two variables into the Test Pairs List box and check Wilcoxon in the Test Type box, then click OK. The results should appear in the output Viewer window.
- You can obtain the boxplots in the same manner as for the M-W except click Summaries of separate variables and move both variables into the Boxes Represents box.
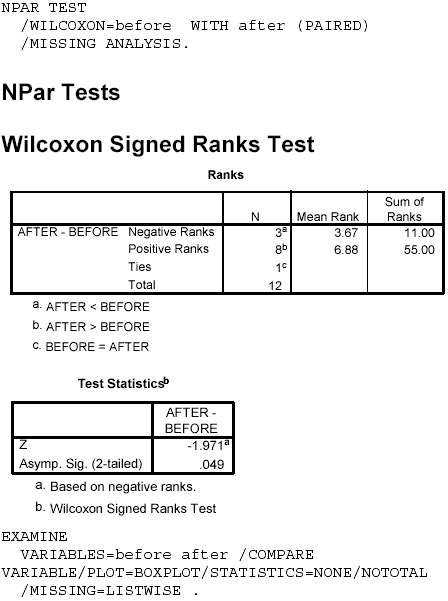
Notes on Reading the Output- The sum of the ranks with the less frequent sign is 11 (T = 11), which is the smaller of the two values in the Ranks box under Sum of Ranks. The Test Statistics box gives T converted to a z score and the p value for z. The results indicate that the null hypothesis of identical population distributions is rejected, T = 11, p = .049.
- To determine the direction of the group differences, examine the N and Mean Rank of the AFTERBEFORE differences given in the Ranks box. There are more positive than negative ranks, which indicates that the After group is greater than the Before group in risk.
- In this particular example, the boxplot does not clearly show the After group to be greater in risk.
 <a onClick="window.open('/olcweb/cgi/pluginpop.cgi?it=gif:: ::/sites/dl/free/0072832517/55324/c15_spss4.gif','popWin', 'width=NaN,height=NaN,resizable,scrollbars');" href="#"><img valign="absmiddle" height="16" width="16" border="0" src="/olcweb/styles/shared/linkicons/image.gif"> (18.0K)</a> <a onClick="window.open('/olcweb/cgi/pluginpop.cgi?it=gif:: ::/sites/dl/free/0072832517/55324/c15_spss4.gif','popWin', 'width=NaN,height=NaN,resizable,scrollbars');" href="#"><img valign="absmiddle" height="16" width="16" border="0" src="/olcweb/styles/shared/linkicons/image.gif"> (18.0K)</a>  <a onClick="window.open('/olcweb/cgi/pluginpop.cgi?it=gif:: ::/sites/dl/free/0072832517/55324/c15_spss5.gif','popWin', 'width=NaN,height=NaN,resizable,scrollbars');" href="#"><img valign="absmiddle" height="16" width="16" border="0" src="/olcweb/styles/shared/linkicons/image.gif"> (7.0K)</a> <a onClick="window.open('/olcweb/cgi/pluginpop.cgi?it=gif:: ::/sites/dl/free/0072832517/55324/c15_spss5.gif','popWin', 'width=NaN,height=NaN,resizable,scrollbars');" href="#"><img valign="absmiddle" height="16" width="16" border="0" src="/olcweb/styles/shared/linkicons/image.gif"> (7.0K)</a> 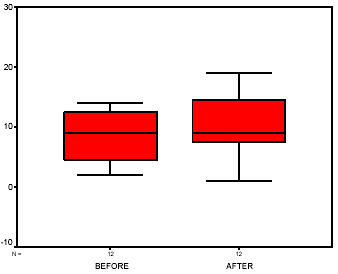 <a onClick="window.open('/olcweb/cgi/pluginpop.cgi?it=gif:: ::/sites/dl/free/0072832517/55324/c15_spss6.gif','popWin', 'width=NaN,height=NaN,resizable,scrollbars');" href="#"><img valign="absmiddle" height="16" width="16" border="0" src="/olcweb/styles/shared/linkicons/image.gif"> (3.0K)</a>
Example-Kruskal-Wallis Test: We will use SPSS to work Problem 3, a K-W example. The steps are as
follows: <a onClick="window.open('/olcweb/cgi/pluginpop.cgi?it=gif:: ::/sites/dl/free/0072832517/55324/c15_spss6.gif','popWin', 'width=NaN,height=NaN,resizable,scrollbars');" href="#"><img valign="absmiddle" height="16" width="16" border="0" src="/olcweb/styles/shared/linkicons/image.gif"> (3.0K)</a>
Example-Kruskal-Wallis Test: We will use SPSS to work Problem 3, a K-W example. The steps are as
follows:- Start SPSS and name variables group and irritate. Enter the data, coding the groups 1, 2, and 3 for the diet groups A, B, and C, respectively.
- Select Analyze > Nonparametric Tests > K Independent Samples.
- In the dialog box, move irritate into the Test Variable List box and move group into the Grouping Variable box. Click Define Range, indicate the minimum (1) and maximum (3) range for the grouping variable, then click Continue.
- Be sure Kruskal-Wallis H is checked in the Test Type box (it should be by default), then OK, and the results should appear in the output Viewer window.
- Obtain the boxplot of groups by adapting the instructions given in the M-W example to this problem.
- Looking ahead, we see that the test is significant, so we will need to perform pairwise M-W tests to determine the group differences. Follow the steps in the M-W example and compare groups 1 and 2, 1 and 3, and 2 and 3.
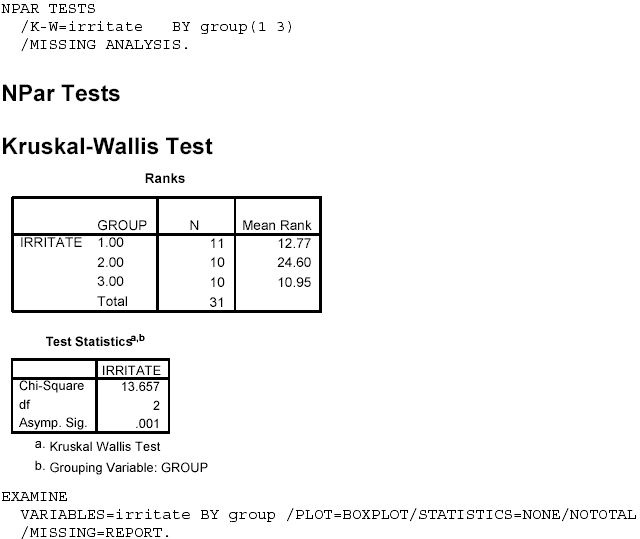
Notes on Reading the Output- The output provides the mean ranks for each group in the Ranks box. In the Test Statistics box, SPSS does not provide the exact H value; instead, a chi-square equivalent is given with a p value.
- The results indicate that the null hypothesis is rejected, and the samples come from different populations. We conclude that the diet groups are significantly different in terms of irritability by the K-W test, c2 (2, N = 31) = 13.657, p = .001. The mean ranks in ascending order are as follows: Diet C = 10.95, Diet A = 12.77, and Diet B = 24.6.
- The boxplot indicates that Group 2 (Diet B) is higher than either of the other two groups, which do not appear to differ. Further testing is needed to confirm this observation.
- Pairwise group comparisons: Comparison 1 versus 2 (Diet A vs. Diet B) indicates that Diet B animals have higher irritability than Diet A animals, U = 12, p = .002. Comparison 1 versus 3 (Diet A vs. Diet C) showed no significant difference in irritability, U = 47.5, p = .59. Comparison 2 versus 3 (Diet B vs. Diet C) indicated that Diet B rats had higher irritability than Diet C rats, U = 7.0, p = .001. These results can be summarized in terms of irritability as follows: Diet C = Diet A < Diet B.
 <a onClick="window.open('/olcweb/cgi/pluginpop.cgi?it=gif:: ::/sites/dl/free/0072832517/55324/c15_spss7.gif','popWin', 'width=NaN,height=NaN,resizable,scrollbars');" href="#"><img valign="absmiddle" height="16" width="16" border="0" src="/olcweb/styles/shared/linkicons/image.gif"> (15.0K)</a> <a onClick="window.open('/olcweb/cgi/pluginpop.cgi?it=gif:: ::/sites/dl/free/0072832517/55324/c15_spss7.gif','popWin', 'width=NaN,height=NaN,resizable,scrollbars');" href="#"><img valign="absmiddle" height="16" width="16" border="0" src="/olcweb/styles/shared/linkicons/image.gif"> (15.0K)</a> 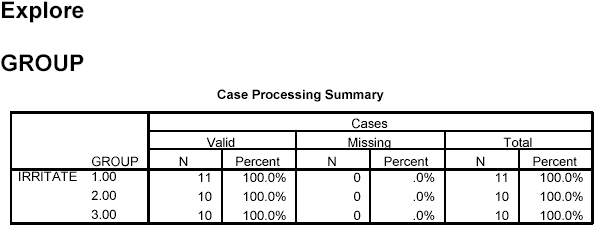 <a onClick="window.open('/olcweb/cgi/pluginpop.cgi?it=gif:: ::/sites/dl/free/0072832517/55324/c15_spss8.gif','popWin', 'width=NaN,height=NaN,resizable,scrollbars');" href="#"><img valign="absmiddle" height="16" width="16" border="0" src="/olcweb/styles/shared/linkicons/image.gif"> (9.0K)</a> <a onClick="window.open('/olcweb/cgi/pluginpop.cgi?it=gif:: ::/sites/dl/free/0072832517/55324/c15_spss8.gif','popWin', 'width=NaN,height=NaN,resizable,scrollbars');" href="#"><img valign="absmiddle" height="16" width="16" border="0" src="/olcweb/styles/shared/linkicons/image.gif"> (9.0K)</a> 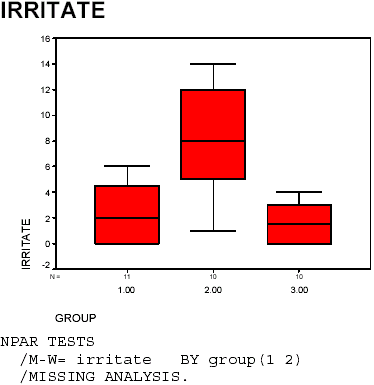 <a onClick="window.open('/olcweb/cgi/pluginpop.cgi?it=gif:: ::/sites/dl/free/0072832517/55324/c15_spss9.gif','popWin', 'width=NaN,height=NaN,resizable,scrollbars');" href="#"><img valign="absmiddle" height="16" width="16" border="0" src="/olcweb/styles/shared/linkicons/image.gif"> (6.0K)</a> <a onClick="window.open('/olcweb/cgi/pluginpop.cgi?it=gif:: ::/sites/dl/free/0072832517/55324/c15_spss9.gif','popWin', 'width=NaN,height=NaN,resizable,scrollbars');" href="#"><img valign="absmiddle" height="16" width="16" border="0" src="/olcweb/styles/shared/linkicons/image.gif"> (6.0K)</a> 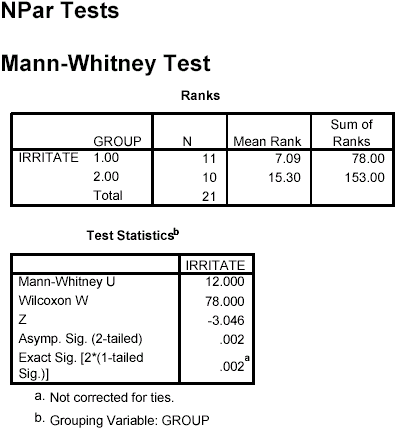 <a onClick="window.open('/olcweb/cgi/pluginpop.cgi?it=gif:: ::/sites/dl/free/0072832517/55324/c15_spss10.gif','popWin', 'width=NaN,height=NaN,resizable,scrollbars');" href="#"><img valign="absmiddle" height="16" width="16" border="0" src="/olcweb/styles/shared/linkicons/image.gif"> (13.0K)</a> <a onClick="window.open('/olcweb/cgi/pluginpop.cgi?it=gif:: ::/sites/dl/free/0072832517/55324/c15_spss10.gif','popWin', 'width=NaN,height=NaN,resizable,scrollbars');" href="#"><img valign="absmiddle" height="16" width="16" border="0" src="/olcweb/styles/shared/linkicons/image.gif"> (13.0K)</a> 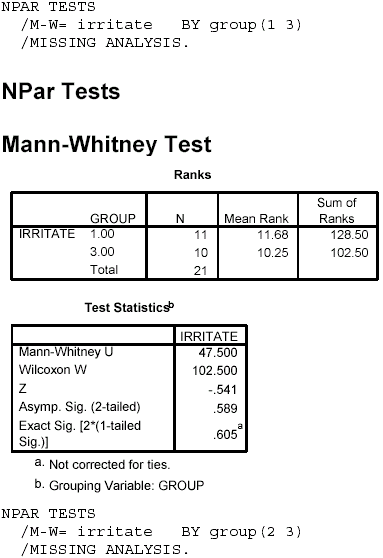 <a onClick="window.open('/olcweb/cgi/pluginpop.cgi?it=gif:: ::/sites/dl/free/0072832517/55324/c15_spss11.gif','popWin', 'width=NaN,height=NaN,resizable,scrollbars');" href="#"><img valign="absmiddle" height="16" width="16" border="0" src="/olcweb/styles/shared/linkicons/image.gif"> (16.0K)</a> <a onClick="window.open('/olcweb/cgi/pluginpop.cgi?it=gif:: ::/sites/dl/free/0072832517/55324/c15_spss11.gif','popWin', 'width=NaN,height=NaN,resizable,scrollbars');" href="#"><img valign="absmiddle" height="16" width="16" border="0" src="/olcweb/styles/shared/linkicons/image.gif"> (16.0K)</a> 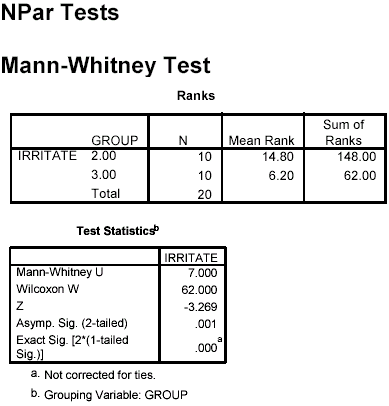 <a onClick="window.open('/olcweb/cgi/pluginpop.cgi?it=gif:: ::/sites/dl/free/0072832517/55324/c15_spss12.gif','popWin', 'width=NaN,height=NaN,resizable,scrollbars');" href="#"><img valign="absmiddle" height="16" width="16" border="0" src="/olcweb/styles/shared/linkicons/image.gif"> (12.0K)</a> Exercises Using SPSS <a onClick="window.open('/olcweb/cgi/pluginpop.cgi?it=gif:: ::/sites/dl/free/0072832517/55324/c15_spss12.gif','popWin', 'width=NaN,height=NaN,resizable,scrollbars');" href="#"><img valign="absmiddle" height="16" width="16" border="0" src="/olcweb/styles/shared/linkicons/image.gif"> (12.0K)</a> Exercises Using SPSS- Work Problem 2, using SPSS to perform the Mann-Whitney test. Also provide boxplots of the data and write a conclusion.
- Use SPSS to perform the Wilcoxon test on the data in Problem 7. Also provide boxplots of the data and write a conclusion.
- Use SPSS to perform the K-W test on the data in Problem 8. Also provide boxplots of the data. If overall differences are obtained, do all pairwise comparisons using the M-W test; interpret the results in the context of the problem.
 Click here to view the answers. (215.0K) Click here to view the answers. (215.0K)
|
|


 2003 McGraw-Hill Higher Education


