USING SPSS—EXAMPLE AND EXERCISE SPSS has a specific, easy-to-use procedure for computing the one-sample t test. Example: We will use SPSS to work Self-Test Exercise 7. The steps are as follows: - Start SPSS, enter the data, and name the variable hypochon.
- Analyze>Compare Means>One-Sample T Test.
- Move hypochon into the Test Variables box and enter 49.2 as the Test Value. Note that the Test Value is m0, the hypothesized value for m for the null hypothesis.
- Click OK and the solution should appear in the output Viewer window.
- To obtain the 95% CI for m, we must trick SPSS a bit and enter a Test Value of 0 and click OK.
- Only the CI values should be read from this portion of the output.
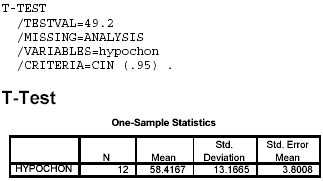
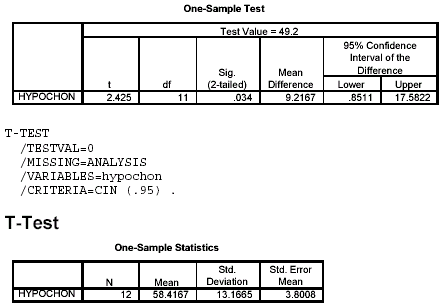
Notes on Reading the Output - 1. The column labeled "Sig. (2-tailed)" gives the exact p value for the computed t = 2.425. This means that p = .034, and we need not look up the critical values for t at the .05 or .01 levels. Our rule for rejecting H0 can now be based on whether "Sig. (2-tailed)" or p ≤ .05.
- 2. The 95% CI is the CI on the difference between the sample mean and the hypothesized mean. In order to obtain the correct CI, we must re-run the analysis with a Test Value set to 0. This portion of the output will give the correct CI, but the t value will not be correct and should be ignored. The solution output for the data of Self-Test Exercise 7 is as follows:
 <a onClick="window.open('/olcweb/cgi/pluginpop.cgi?it=gif:: ::/sites/dl/free/0072832517/55318/c9_spss1.gif','popWin', 'width=NaN,height=NaN,resizable,scrollbars');" href="#"><img valign="absmiddle" height="16" width="16" border="0" src="/olcweb/styles/shared/linkicons/image.gif"> (5.0K)</a> <a onClick="window.open('/olcweb/cgi/pluginpop.cgi?it=gif:: ::/sites/dl/free/0072832517/55318/c9_spss1.gif','popWin', 'width=NaN,height=NaN,resizable,scrollbars');" href="#"><img valign="absmiddle" height="16" width="16" border="0" src="/olcweb/styles/shared/linkicons/image.gif"> (5.0K)</a>
Sig. (2-tailed) is the exact p value for the computed t = 2.425 and p = .034.  <a onClick="window.open('/olcweb/cgi/pluginpop.cgi?it=gif:: ::/sites/dl/free/0072832517/55318/c9_spss2.gif','popWin', 'width=NaN,height=NaN,resizable,scrollbars');" href="#"><img valign="absmiddle" height="16" width="16" border="0" src="/olcweb/styles/shared/linkicons/image.gif"> (9.0K)</a> <a onClick="window.open('/olcweb/cgi/pluginpop.cgi?it=gif:: ::/sites/dl/free/0072832517/55318/c9_spss2.gif','popWin', 'width=NaN,height=NaN,resizable,scrollbars');" href="#"><img valign="absmiddle" height="16" width="16" border="0" src="/olcweb/styles/shared/linkicons/image.gif"> (9.0K)</a>
Only the 95% CI is correct for the following output.  <a onClick="window.open('/olcweb/cgi/pluginpop.cgi?it=gif:: ::/sites/dl/free/0072832517/55318/c9_spss3.gif','popWin', 'width=NaN,height=NaN,resizable,scrollbars');" href="#"><img valign="absmiddle" height="16" width="16" border="0" src="/olcweb/styles/shared/linkicons/image.gif"> (5.0K)</a> <a onClick="window.open('/olcweb/cgi/pluginpop.cgi?it=gif:: ::/sites/dl/free/0072832517/55318/c9_spss3.gif','popWin', 'width=NaN,height=NaN,resizable,scrollbars');" href="#"><img valign="absmiddle" height="16" width="16" border="0" src="/olcweb/styles/shared/linkicons/image.gif"> (5.0K)</a>
Exercise Using SPSS - We have conducted a study of the verbal skills of females. The task was to unscramble 20 sentences within a 10-minute period. (Example: free are things best the life in—The best things in life are free.) Each of the 20 participants received a score indicating the number of sentences she unscrambled correctly. Several previous studies over the last 2 years have indicated that females averaged a score of 9.0 on the task. Using SPSS, test the hypothesis that this year’s sample performed differently than in the past. Also provide a 95% CI for the population mean for this sample. The data are as follows: 15, 15, 14, 14, 13, 13, 13, 11, 11, 11, 11, 10, 10, 9, 9, 9, 8, 8, 6, 3. Write a brief conclusion for the hypothesis test. Also, interpret the confidence interval.
 Click here to view the answers. (62.0K) Click here to view the answers. (62.0K)
|


 2003 McGraw-Hill Higher Education

