 |
| 1 | |
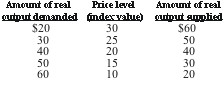
Answer the next question on the basis of the following aggregate demand and supply schedules for a hypothetical economy:
 <a onClick="window.open('/olcweb/cgi/pluginpop.cgi?it=jpg::::/sites/dl/free/0073273082/384258/quiz10b_1.jpg','popWin', 'width=NaN,height=NaN,resizable,scrollbars');" href="#"><img valign="absmiddle" height="16" width="16" border="0" src="/olcweb/styles/shared/linkicons/image.gif"> (6.0K)</a> <a onClick="window.open('/olcweb/cgi/pluginpop.cgi?it=jpg::::/sites/dl/free/0073273082/384258/quiz10b_1.jpg','popWin', 'width=NaN,height=NaN,resizable,scrollbars');" href="#"><img valign="absmiddle" height="16" width="16" border="0" src="/olcweb/styles/shared/linkicons/image.gif"> (6.0K)</a>
Refer to the above data. If the full employment level of output is $500: |
| | A) | this economy has a negative GDP gap |
| | B) | this economy has a positive GDP gap |
| | C) | the government could achieve the full employment level of output by increasing taxes |
| | D) | this economy would move toward full employment if its currency appreciated |
|
|
|
| 2 | |
A leftward shift of the aggregate supply curve would illustrate: |
| | A) | demand-pull inflation |
| | B) | an inflationary gap |
| | C) | a positive GDP gap |
| | D) | cost-push inflation |
|
|
|
| 3 | |
At very low levels of output, the aggregate supply curve is relatively: |
| | A) | flat, because firms are reluctant to give workers raises when output is so low |
| | B) | flat, because firms can expand output with relatively little increase in per-unit production costs |
| | C) | steep, because increasing output will cause relative large increases in per-unit production costs |
| | D) | steep, because increasing output will cause aggregate demand to increase |
|
|
|
| 4 | |
If real output per unit of input rises by 10%: |
| | A) | measured productivity will increase |
| | B) | per-unit production costs will rise |
| | C) | the aggregate supply curve will shift to the left |
| | D) | the price level will tend to increase |
|
|
|
| 5 | |
The aggregate demand curve slopes downward to the right: |
| | A) | because a lower domestic price level reduces net exports |
| | B) | because of the income and substitution effects of lower prices |
| | C) | at low prices, but not at high prices |
| | D) | because a lower price level reduces the demand for money, which lowers the interest rate and increases desired investment |
|
|
|
| 6 | |
Suppose that real domestic output in an economy is 200 units, the quantity of inputs is 50, and the price of each input is $20. The level of productivity is: |
| | A) | 1/5 |
| | B) | 2.5 |
| | C) | 4 |
| | D) | 10 |
|
|
|
| 7 | |
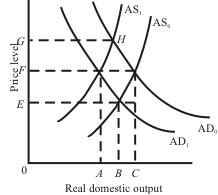
Use the following graph to answer the next question:
 <a onClick="window.open('/olcweb/cgi/pluginpop.cgi?it=jpg::::/sites/dl/free/0073273082/384258/quiz10b_7.jpg','popWin', 'width=NaN,height=NaN,resizable,scrollbars');" href="#"><img valign="absmiddle" height="16" width="16" border="0" src="/olcweb/styles/shared/linkicons/image.gif"> (10.0K)</a> <a onClick="window.open('/olcweb/cgi/pluginpop.cgi?it=jpg::::/sites/dl/free/0073273082/384258/quiz10b_7.jpg','popWin', 'width=NaN,height=NaN,resizable,scrollbars');" href="#"><img valign="absmiddle" height="16" width="16" border="0" src="/olcweb/styles/shared/linkicons/image.gif"> (10.0K)</a>
Refer to the graph. Cost-push inflation is best illustrated by the shift from: |
| | A) | AD0 to AD1 |
| | B) | AD1 to AD0 |
| | C) | AS0 to AS1 |
| | D) | AS1 to AS0 |
|
|
|
| 8 | |
All else equal, depreciation of the dollar will shift: |
| | A) | both aggregate demand and aggregate supply to the left |
| | B) | both aggregate demand and aggregate supply to the right |
| | C) | aggregate demand to the left and aggregate supply to the right |
| | D) | aggregate demand to the right and aggregate supply to the left |
|
|
|
| 9 | |
If real output increases and the price level remains stable, it is likely that: |
| | A) | both aggregate demand and aggregate supply have decreased |
| | B) | aggregate demand has increased and aggregate supply has decreased |
| | C) | aggregate demand has decreased and aggregate supply has increased |
| | D) | both aggregate demand and aggregate supply have increased |
|
|
|
| 10 | |
An increase in the incomes of U.S. trading partners would shift the U.S.: |
| | A) | aggregate demand curve to the right |
| | B) | aggregate demand curve to the left |
| | C) | aggregate supply curve to the right |
| | D) | aggregate supply curve to the left |
|
|