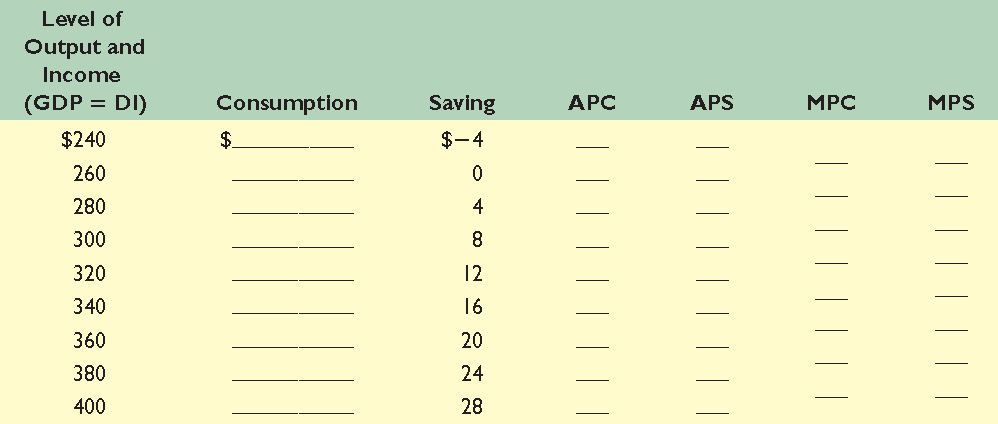
(See related pages)
1. Complete the following table:
 2. Suppose a handbill publisher can buy a new duplicating machine for $500 and the duplicator has a 1-year life. The machine is expected to contribute $550 to the year's net revenue. What is the expected rate of return? If the real interest rate at which funds can be borrowed to purchase the machine is 8 percent, will the publisher choose to invest in the machine? Explain. 3. Assume there are no investment projects in the economy that yield an expected rate of return of 25 percent or more. But suppose there are $10 billion of investment projects yielding expected returns of between 20 and 25 percent; another $10 billion yielding between 15 and 20 percent; another $10 billion between 10 and 15 percent; and so forth. Cumulate these data and present them graphically, putting the expected rate of return on the vertical axis and the amount of investment on the horizontal axis. What will be the equilibrium level of aggregate investment if the real interest rate is (a) 15 percent, (b) 10 percent, and (c) 5 percent? Explain why this curve is the investment demand curve. 4. What is the multiplier effect? What relationship does the MPC bear to the size of the multiplier? The MPS? What will the multiplier be when the MPS is 0, .4, .6, and 1? What will it be when the MPC is 1, .90, .67, .50, and 0? How much of a change in GDP will result if firms increase their level of investment by $8 billion and the MPC is .80? If the MPC is .67? |