 |
| 1 |  | 
The consumption schedule is: |
|  | A) | an inverse relationship between consumption and the price level |
|  | B) | a direct relationship between consumption and disposable income |
|  | C) | an inverse relationship between consumption and saving |
|  | D) | an inverse relationship between consumption and the tax rate |
|
|
 |
| 2 |  | 
A household's disposable income increases from $50,000 to $60,000 and its consumption increases from $45,000 to $52,000. Consequently, we can conclude: |
|  | A) | the MPC is $7000 |
|  | B) | the slope of the consumption schedule is .9 |
|  | C) | the MPS is .3 |
|  | D) | the consumption schedule must have shifted upwards |
|
|
 |
| 3 |  | 
Along a particular saving schedule, each change in disposable income of $15 billion generates an additional $3 billion in saving. Therefore: |
|  | A) | the MPS is .3 |
|  | B) | the MPS is .2 |
|  | C) | the APC is .8 |
|  | D) | the slope of the consumption schedule is .7 |
|
|
 |
| 4 |  | 
Following the stock market collapse of 2000, there was a significant drop in the value of household wealth. As a result of the wealth effect: |
|  | A) | the saving schedule shifted upward |
|  | B) | the consumption schedule shifted upward |
|  | C) | the marginal propensity to save increased |
|  | D) | the marginal propensity to consume increased |
|
|
 |
| 5 |  | 
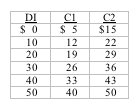
Answer the next question on the basis of the following data:
 <a onClick="window.open('/olcweb/cgi/pluginpop.cgi?it=jpg::::/sites/dl/free/0073273082/384256/quiz8c_5.jpg','popWin', 'width=NaN,height=NaN,resizable,scrollbars');" href="#"><img valign="absmiddle" height="16" width="16" border="0" src="/olcweb/styles/shared/linkicons/image.gif"> (5.0K)</a> <a onClick="window.open('/olcweb/cgi/pluginpop.cgi?it=jpg::::/sites/dl/free/0073273082/384256/quiz8c_5.jpg','popWin', 'width=NaN,height=NaN,resizable,scrollbars');" href="#"><img valign="absmiddle" height="16" width="16" border="0" src="/olcweb/styles/shared/linkicons/image.gif"> (5.0K)</a>
|
|  | A) | the MPC and the APC stay the same at every level of income |
|  | B) | the MPC remains the same but the APC is higher at every level of income |
|  | C) | the MPC and the APC are both higher at every level of income |
|  | D) | the APC remains the same but the MPC is higher at every level of income |
|
|
 |
| 6 |  | 
Immediately prior to the second Iraq war in 2003, there was a drop in both consumer and firm optimism about the future of the economy. This change likely: |
|  | A) | shifted the consumption schedule down and caused a movement up and to the left along the investment demand curve |
|  | B) | shifted the consumption schedule down and shifted the investment demand curve to the left |
|  | C) | shifted the investment demand curve to the left and caused a movement down and to the left along the consumption schedule |
|  | D) | caused a movement down and to the left along the consumption schedule and a movement up and to the left along the investment demand curve |
|
|
 |
| 7 |  | 
In general, the greater the MPS: |
|  | A) | the steeper the consumption schedule |
|  | B) | the lower the multiplier |
|  | C) | the greater the change in GDP for any given initial change in spending |
|  | D) | the greater the APC |
|
|
 |
| 8 |  | 
The higher the expected real rate of return on investments, the more investment is likely to occur. |
|  | A) | True |
|  | B) | False |
|
|
 |
| 9 |  | 
If an initial $20 billion dollar increase in investment spending creates $15 billion of new spending in the second round, the multiplier is: |
|  | A) | 2 |
|  | B) | 3 |
|  | C) | 4 |
|  | D) | 5 |
|
|
 |
| 10 |  | 
The value of the multiplier will increase if: |
|  | A) | the APC decreases |
|  | B) | the MPC decreases |
|  | C) | the consumption schedule shifts upward parallel to itself |
|  | D) | the MPS decreases |
|
|

