 |
| 1 |  | 
Compared to the downward-sloping demand curve for the output of a competitive industry, a single firm operating in that industry faces: |
|  | A) | a perfectly inelastic demand curve |
|  | B) | a perfectly elastic demand curve |
|  | C) | a unit elastic demand curve |
|  | D) | a downward-sloping marginal revenue curve |
|
|
 |
| 2 |  | 
Which of the following is a characteristic of equilibrium in long-run competitive markets? |
|  | A) | Consumer surplus is minimized |
|  | B) | Producer surplus exceeds consumer surplus |
|  | C) | Combined consumer and producer surplus is maximized |
|  | D) | The difference between producer surplus and consumer surplus is maximized |
|
|
 |
| 3 |  | 
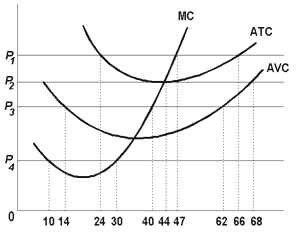
Use the following diagram to answer the next question.
 <a onClick="window.open('/olcweb/cgi/pluginpop.cgi?it=jpg::::/sites/dl/free/0073365955/627566/q3.jpg','popWin', 'width=NaN,height=NaN,resizable,scrollbars');" href="#"><img valign="absmiddle" height="16" width="16" border="0" src="/olcweb/styles/shared/linkicons/image.gif"> (23.0K)</a> <a onClick="window.open('/olcweb/cgi/pluginpop.cgi?it=jpg::::/sites/dl/free/0073365955/627566/q3.jpg','popWin', 'width=NaN,height=NaN,resizable,scrollbars');" href="#"><img valign="absmiddle" height="16" width="16" border="0" src="/olcweb/styles/shared/linkicons/image.gif"> (23.0K)</a>
At which of the following prices will the firm produce a positive amount but incur a loss? |
|  | A) | P1 |
|  | B) | P2 |
|  | C) | P3 |
|  | D) | P3 and P4 |
|
|
 |
| 4 |  | 
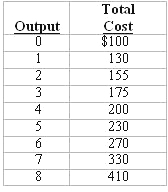
Answer the next question on the basis of the following cost data for a competitive firm.
 <a onClick="window.open('/olcweb/cgi/pluginpop.cgi?it=jpg::::/sites/dl/free/0073365955/627566/q4.jpg','popWin', 'width=NaN,height=NaN,resizable,scrollbars');" href="#"><img valign="absmiddle" height="16" width="16" border="0" src="/olcweb/styles/shared/linkicons/image.gif"> (12.0K)</a> <a onClick="window.open('/olcweb/cgi/pluginpop.cgi?it=jpg::::/sites/dl/free/0073365955/627566/q4.jpg','popWin', 'width=NaN,height=NaN,resizable,scrollbars');" href="#"><img valign="absmiddle" height="16" width="16" border="0" src="/olcweb/styles/shared/linkicons/image.gif"> (12.0K)</a>
Refer to the above data. If the market price is $35 and the firm produces its optimal amount, it will: |
|  | A) | realize a $5 profit |
|  | B) | realize a $50 profit |
|  | C) | incur a $5 loss |
|  | D) | incur a $55 loss |
|
|
 |
| 5 |  | 
Competitive firms maximize: |
|  | A) | total profits by producing where price exceeds average total cost by the greatest amount |
|  | B) | per unit profits by producing where marginal revenue equals marginal cost |
|  | C) | total profits by producing where price equals marginal cost |
|  | D) | market share by producing where price equals average total cost |
|
|
 |
| 6 |  | 
Suppose a decrease in product demand occurs in a decreasing-cost industry. Compared to the original equilibrium the new long-run competitive equilibrium will entail: |
|  | A) | a higher price and a higher total output |
|  | B) | a lower price and a lower total output |
|  | C) | a higher price and a lower total output |
|  | D) | a lower price and a higher total output |
|
|
 |
| 7 |  | 
A competitive firm is currently producing 2000 units per month at a total cost of $12,000. Its fixed costs are $1,000 and its marginal cost is $5. If the market price is $5.60, this firm: |
|  | A) | should shut down |
|  | B) | should increase production |
|  | C) | is making an economic profit, but not an accounting profit |
|  | D) | is maximizing profits |
|
|
 |
| 8 |  | 
For all values above minimum average variable cost, a competitive firm's: |
|  | A) | supply curve is coincident with its marginal cost curve |
|  | B) | supply curve is coincident with its average total cost curve |
|  | C) | demand curve is coincident with its average total cost curve |
|  | D) | demand curve is coincident with its supply curve |
|
|
 |
| 9 |  | 
Use the following diagrams to answer the next question.
 <a onClick="window.open('/olcweb/cgi/pluginpop.cgi?it=jpg::::/sites/dl/free/0073365955/627566/q9.jpg','popWin', 'width=NaN,height=NaN,resizable,scrollbars');" href="#"><img valign="absmiddle" height="16" width="16" border="0" src="/olcweb/styles/shared/linkicons/image.gif"> (14.0K)</a> <a onClick="window.open('/olcweb/cgi/pluginpop.cgi?it=jpg::::/sites/dl/free/0073365955/627566/q9.jpg','popWin', 'width=NaN,height=NaN,resizable,scrollbars');" href="#"><img valign="absmiddle" height="16" width="16" border="0" src="/olcweb/styles/shared/linkicons/image.gif"> (14.0K)</a>
Refer to the above diagrams, which pertain to a purely competitive firm and the industry in which it operates. In the long run we should expect: |
|  | A) | new firms to enter, market demand to rise, and price to fall |
|  | B) | demand to increase, and price to rise |
|  | C) | input prices to fall, supply to increase, and price to fall |
|  | D) | some firms to exit, supply to decrease, and price to rise |
|
|
 |
| 10 |  | 
In the long run, competitive markets achieve: |
|  | A) | allocative efficiency because P = min ATC but not productive efficiency because P > min AVC |
|  | B) | allocative efficiency because P = MC and productive efficiency because P = min ATC |
|  | C) | productive efficiency because P = min ATC but not allocative efficiency because P > MR |
|  | D) | neither productive nor allocative efficiency |
|
|

