You must have javascript enabled to view this website. Please change your browser preferences to enable javascript, and reload this page.
Hate Crimes: Incidents, Offenses, Victims and Known Offenders (See related pages) <a onClick="window.open('/olcweb/cgi/pluginpop.cgi?it=jpg::::/sites/dl/free/0073511935/535068/Hate_Crimes_p1.jpg','popWin', 'width=NaN,height=NaN,resizable,scrollbars');" href="#"><img valign="absmiddle" height="16" width="16" border="0" src="/olcweb/styles/shared/linkicons/image.gif"> (73.0K)</a> Death Truck Two white men chained a black man to the rear of this pickup and dragged him to his death in what authorities described as a hate crime. -- Ron Jaap, Beaumont (Tex.) Enterprise
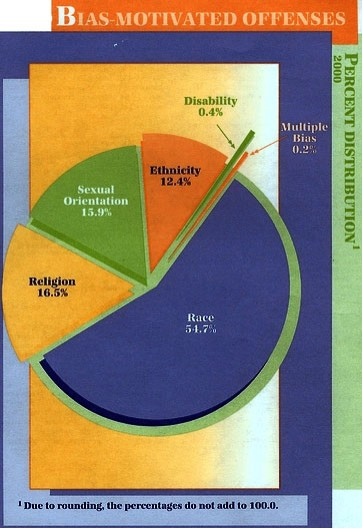
Bias motivation Incidents Offenses Victims Known Total 8,152 9,524 10,021 7,642 Single-Bias Incidents 8,144 9,507 10,003 7,632 Race: 4,368 5,206 5,435 4,498 Anti-White 886 1,061 1,091 1,182 Anti-Black 2,904 3,433 3,562 2,832 Anti-American Indian/Alaskan Native 57 62 64 58 Anti-Asian/Pacific Islander 281 317 339 273 Anti-Multi-Racial Group 240 333 379 133 Religion: 1,483 1,568 1,711 590 Anti-Jewish 1,119 1,172 1,280 417 Anti-Catholic 56 61 63 33 Anti-Protestant 59 62 62 23 Anti-Islamic 28 33 36 20 Anti-Other Religious Group 173 188 211 78 Anti-Multi-Religious Group 44 46 52 18 Anti-Atheism/Agnosticism/ etc. 4 6 7 1 Sexual Orientation: 1,330 1,517 1,589 1,471 Anti-Male Homosexual 925 1,052 1,089 1,112 Anti-Female Homosexual 181 213 230 173 Anti-Homosexual 182 210 226 153 Anti-Heterosexual 22 22 24 18 Anti-Bisexual 20 20 20 15 Ethnicity/National Origin: 927 1,180 1,232 1,037 Anti-Hispanic 567 745 773 711 Anti-Other Ethnicity/National Origin 360 435 459 326 Disability: 36 36 36 36 Anti-Physical 20 20 20 22 Anti-Mental 16 16 16 14 Multiple-Bias Incidents 8 17 18 10
<a onClick="window.open('/olcweb/cgi/pluginpop.cgi?it=jpg::::/sites/dl/free/0073511935/535068/Hate_Crimes_p2.jpg','popWin', 'width=NaN,height=NaN,resizable,scrollbars');" href="#"><img valign="absmiddle" height="16" width="16" border="0" src="/olcweb/styles/shared/linkicons/image.gif"> (132.0K)</a>
Hate Crimes by State
Participating states Number of Population Agencies Total number Total 11,690 236,929,512 1,895 8,152 Alaska 1 260,900 1 4 Arizona 88 4,606,625 22 240 Arkansas 4 77,190 3 3 California 722 33,869,172 259 1,943 Colorado 234 4,300,597 34 101 Connecticut 97 3,316,062 58 151 Delaware 52 783,600 9 34 District of Columbia 1 572,059 1 5 Florida 491 15,955,498 107 240 Georgia 80 1,077,028 4 35 Idaho 118 1,278,863 26 45 Illinois 46 4,463,308 45 183 Indiana 166 4,415,055 31 106 Iowa 220 2,809,355 15 33 Kansas 1 339,907 1 42 Kentucky 317 3,351,405 38 73 Louisiana 174 3,827,857 8 12 Maine 181 1,273,365 9 28 Maryland 146 5,294,196 33 217 Massachusetts 341 6,282,763 97 458 Michigan 620 9,818,683 156 425 Minnesota 313 4,917,158 55 169 Mississippi 78 1,219,754 1 2 Missouri 186 3,843,304 26 70 Montana 102 902,195 8 19 Nebraska 202 1,360,827 6 17 Nevada 37 1,998,257 8 85 New Hampshire 110 678,452 20 32 New Jersey 564 8,414,350 241 652 New Mexico 43 1,076,413 3 15 New York 539 18,973,360 39 697 North Carolina 205 4,485,728 14 31 North Dakota 80 580,299 5 5 Ohio 348 7,469,352 49 240 Oklahoma 301 3,448,945 24 80 Oregon 171 3,411,457 29 142 Pennsylvania 933 11,464,718 32 141 Rhode Island 48 1,048,319 10 48 South Carolina 352 4,009,034 17 33 South Dakota 121 754,844 4 7 Tennessee 422 5,685,152 72 230 Texas 942 20,613,237 72 286 Utah 127 2,233,169 28 71 Vermont 43 507,533 14 19 Virginia 384 6,981,101 59 325 Washington 236 5,352,495 57 242 West Virginia 268 1,669,624 21 60 Wisconsin 368 5,363,675 22 47 Wyoming 67 493,272 2 9