Find the number of larceny thefts committed on your campus in a recent year and compare the figure with campuses in your area of a similar size. The campus crime statistics are in a report compiled annually by the Federal Bureau of Investigation. The report is called "Crime in the United States," and it's online at www.fbi.gov/ucr/ucr.htm: 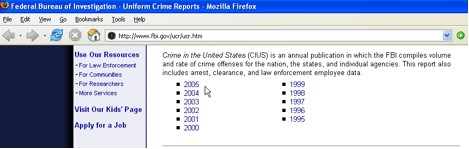 <a onClick="window.open('/olcweb/cgi/pluginpop.cgi?it=jpg::::/sites/dl/free/0073511935/535051/Campus_Larceny_p1.jpg','popWin', 'width=NaN,height=NaN,resizable,scrollbars');" href="#"><img valign="absmiddle" height="16" width="16" border="0" src="/olcweb/styles/shared/linkicons/image.gif"> (45.0K)</a> <a onClick="window.open('/olcweb/cgi/pluginpop.cgi?it=jpg::::/sites/dl/free/0073511935/535051/Campus_Larceny_p1.jpg','popWin', 'width=NaN,height=NaN,resizable,scrollbars');" href="#"><img valign="absmiddle" height="16" width="16" border="0" src="/olcweb/styles/shared/linkicons/image.gif"> (45.0K)</a>
Here's the Web page that showcases the report for 2005: 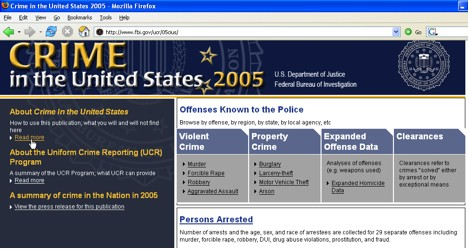 <a onClick="window.open('/olcweb/cgi/pluginpop.cgi?it=jpg::::/sites/dl/free/0073511935/535051/Campus_Larceny_p2.jpg','popWin', 'width=NaN,height=NaN,resizable,scrollbars');" href="#"><img valign="absmiddle" height="16" width="16" border="0" src="/olcweb/styles/shared/linkicons/image.gif"> (96.0K)</a> <a onClick="window.open('/olcweb/cgi/pluginpop.cgi?it=jpg::::/sites/dl/free/0073511935/535051/Campus_Larceny_p2.jpg','popWin', 'width=NaN,height=NaN,resizable,scrollbars');" href="#"><img valign="absmiddle" height="16" width="16" border="0" src="/olcweb/styles/shared/linkicons/image.gif"> (96.0K)</a>
If you click on the "Read more" link under "How to use this publication," you will see a list of all the tables that make up the report. Table 9 contains statistics for colleges and universities: 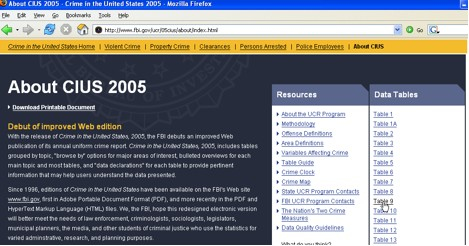 <a onClick="window.open('/olcweb/cgi/pluginpop.cgi?it=jpg::::/sites/dl/free/0073511935/535051/Campus_Larceny_p3.jpg','popWin', 'width=NaN,height=NaN,resizable,scrollbars');" href="#"><img valign="absmiddle" height="16" width="16" border="0" src="/olcweb/styles/shared/linkicons/image.gif"> (92.0K)</a> <a onClick="window.open('/olcweb/cgi/pluginpop.cgi?it=jpg::::/sites/dl/free/0073511935/535051/Campus_Larceny_p3.jpg','popWin', 'width=NaN,height=NaN,resizable,scrollbars');" href="#"><img valign="absmiddle" height="16" width="16" border="0" src="/olcweb/styles/shared/linkicons/image.gif"> (92.0K)</a>
 <a onClick="window.open('/olcweb/cgi/pluginpop.cgi?it=jpg::::/sites/dl/free/0073511935/535051/Campus_Larceny_p4.jpg','popWin', 'width=NaN,height=NaN,resizable,scrollbars');" href="#"><img valign="absmiddle" height="16" width="16" border="0" src="/olcweb/styles/shared/linkicons/image.gif"> (66.0K)</a> <a onClick="window.open('/olcweb/cgi/pluginpop.cgi?it=jpg::::/sites/dl/free/0073511935/535051/Campus_Larceny_p4.jpg','popWin', 'width=NaN,height=NaN,resizable,scrollbars');" href="#"><img valign="absmiddle" height="16" width="16" border="0" src="/olcweb/styles/shared/linkicons/image.gif"> (66.0K)</a>
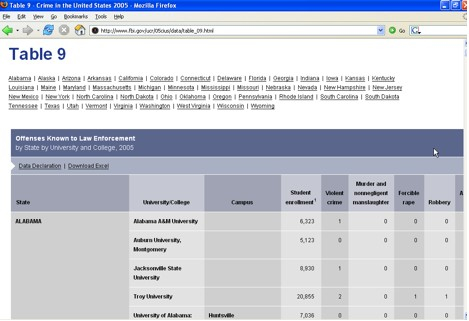
As a Web page, this table is hard to read – because it's so wide and so long. But as you can see, the FBI allows you to download an Excel version of the data. That way, you can analyze the spreadsheet, by sorting the data or by computing crime rates. When you open the data in Excel, it looks like this: 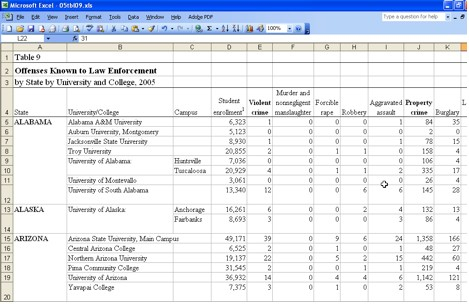 <a onClick="window.open('/olcweb/cgi/pluginpop.cgi?it=jpg::::/sites/dl/free/0073511935/535051/Campus_Larceny_p5.jpg','popWin', 'width=NaN,height=NaN,resizable,scrollbars');" href="#"><img valign="absmiddle" height="16" width="16" border="0" src="/olcweb/styles/shared/linkicons/image.gif"> (83.0K)</a> <a onClick="window.open('/olcweb/cgi/pluginpop.cgi?it=jpg::::/sites/dl/free/0073511935/535051/Campus_Larceny_p5.jpg','popWin', 'width=NaN,height=NaN,resizable,scrollbars');" href="#"><img valign="absmiddle" height="16" width="16" border="0" src="/olcweb/styles/shared/linkicons/image.gif"> (83.0K)</a>
According to the instructions for this assignment, you must compare your school "with campuses in your area of a similar size." To do that, let's scroll down to all of the schools in a particular state. I'll use Virginia as an example. But if I start scrolling, there's a problem: I can't see the column headings in Row 4. So before scrolling, I want to lock in place Row 4, as well as Columns A, B and C (because they identify the school). To lock them in place, put your cursor in Cell D5 and click on Window > Freeze Panes: 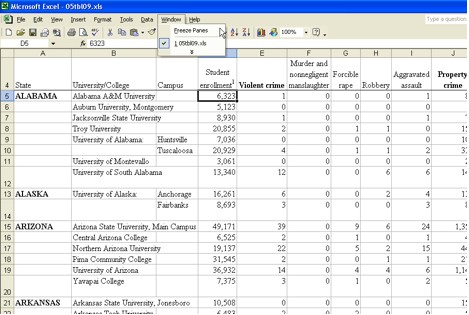 <a onClick="window.open('/olcweb/cgi/pluginpop.cgi?it=jpg::::/sites/dl/free/0073511935/535051/Campus_Larceny_p6.jpg','popWin', 'width=NaN,height=NaN,resizable,scrollbars');" href="#"><img valign="absmiddle" height="16" width="16" border="0" src="/olcweb/styles/shared/linkicons/image.gif"> (80.0K)</a> <a onClick="window.open('/olcweb/cgi/pluginpop.cgi?it=jpg::::/sites/dl/free/0073511935/535051/Campus_Larceny_p6.jpg','popWin', 'width=NaN,height=NaN,resizable,scrollbars');" href="#"><img valign="absmiddle" height="16" width="16" border="0" src="/olcweb/styles/shared/linkicons/image.gif"> (80.0K)</a>
Now, when you scroll down or you scroll to the right, you won't lose your place. If I scroll down to the Virginia schools, I see: 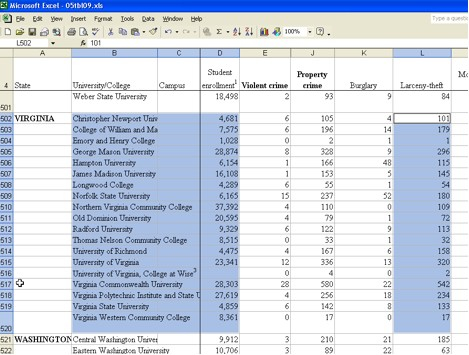 <a onClick="window.open('/olcweb/cgi/pluginpop.cgi?it=jpg::::/sites/dl/free/0073511935/535051/Campus_Larceny_p7.jpg','popWin', 'width=NaN,height=NaN,resizable,scrollbars');" href="#"><img valign="absmiddle" height="16" width="16" border="0" src="/olcweb/styles/shared/linkicons/image.gif"> (104.0K)</a> <a onClick="window.open('/olcweb/cgi/pluginpop.cgi?it=jpg::::/sites/dl/free/0073511935/535051/Campus_Larceny_p7.jpg','popWin', 'width=NaN,height=NaN,resizable,scrollbars');" href="#"><img valign="absmiddle" height="16" width="16" border="0" src="/olcweb/styles/shared/linkicons/image.gif"> (104.0K)</a>
I might want to compare my school (Virginia Commonwealth University) with George Mason University, Old Dominion University, the University of Virginia and Virginia Tech. I would copy the data for those schools in a new spreadsheet: 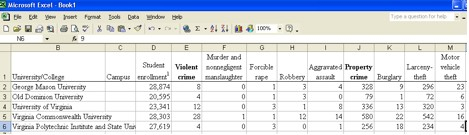 <a onClick="window.open('/olcweb/cgi/pluginpop.cgi?it=jpg::::/sites/dl/free/0073511935/535051/Campus_Larceny_p8.jpg','popWin', 'width=NaN,height=NaN,resizable,scrollbars');" href="#"><img valign="absmiddle" height="16" width="16" border="0" src="/olcweb/styles/shared/linkicons/image.gif"> (42.0K)</a> <a onClick="window.open('/olcweb/cgi/pluginpop.cgi?it=jpg::::/sites/dl/free/0073511935/535051/Campus_Larceny_p8.jpg','popWin', 'width=NaN,height=NaN,resizable,scrollbars');" href="#"><img valign="absmiddle" height="16" width="16" border="0" src="/olcweb/styles/shared/linkicons/image.gif"> (42.0K)</a>
Then, I would sort those rows by the "Larceny-theft" column, by highlighting the data and clicking on Data > Sort: 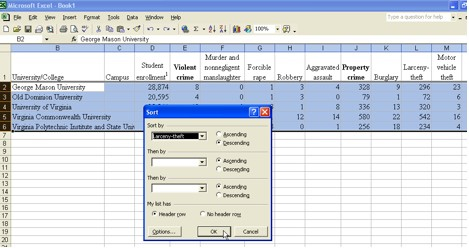 <a onClick="window.open('/olcweb/cgi/pluginpop.cgi?it=jpg::::/sites/dl/free/0073511935/535051/Campus_Larceny_p9.jpg','popWin', 'width=NaN,height=NaN,resizable,scrollbars');" href="#"><img valign="absmiddle" height="16" width="16" border="0" src="/olcweb/styles/shared/linkicons/image.gif"> (75.0K)</a> <a onClick="window.open('/olcweb/cgi/pluginpop.cgi?it=jpg::::/sites/dl/free/0073511935/535051/Campus_Larceny_p9.jpg','popWin', 'width=NaN,height=NaN,resizable,scrollbars');" href="#"><img valign="absmiddle" height="16" width="16" border="0" src="/olcweb/styles/shared/linkicons/image.gif"> (75.0K)</a>
Sorting shows that VCU had the most larceny thefts – far more than the other schools: 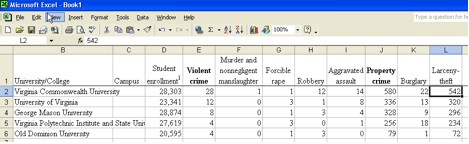 <a onClick="window.open('/olcweb/cgi/pluginpop.cgi?it=jpg::::/sites/dl/free/0073511935/535051/Campus_Larceny_p10.jpg','popWin', 'width=NaN,height=NaN,resizable,scrollbars');" href="#"><img valign="absmiddle" height="16" width="16" border="0" src="/olcweb/styles/shared/linkicons/image.gif"> (45.0K)</a> <a onClick="window.open('/olcweb/cgi/pluginpop.cgi?it=jpg::::/sites/dl/free/0073511935/535051/Campus_Larceny_p10.jpg','popWin', 'width=NaN,height=NaN,resizable,scrollbars');" href="#"><img valign="absmiddle" height="16" width="16" border="0" src="/olcweb/styles/shared/linkicons/image.gif"> (45.0K)</a>When you have numbers like that, you can start writing your story. | Enter your version of the story here: |
|