 |
| 1 |  | 
Comparing the short-run and long-run Phillips curve suggests that: |
|  | A) | there is both a short-run and long-run tradeoff between inflation and unemployment. |
|  | B) | there is neither a short-run nor a long-run tradeoff between inflation and unemployment. |
|  | C) | there is a short-run but not a long-run tradeoff between inflation and unemployment. |
|  | D) | there is a long-run but not a short-run tradeoff between inflation and unemployment. |
|
|
 |
| 2 |  | 
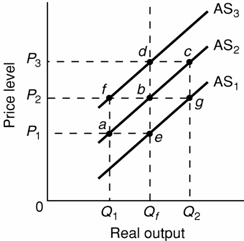
Answer the next question on the basis of the following diagram:
 <a onClick="window.open('/olcweb/cgi/pluginpop.cgi?it=jpg::::/sites/dl/free/0077337727/883763/ch35_q2.jpg','popWin', 'width=NaN,height=NaN,resizable,scrollbars');" href="#"><img valign="absmiddle" height="16" width="16" border="0" src="/olcweb/styles/shared/linkicons/image.gif"> (20.0K)</a> <a onClick="window.open('/olcweb/cgi/pluginpop.cgi?it=jpg::::/sites/dl/free/0077337727/883763/ch35_q2.jpg','popWin', 'width=NaN,height=NaN,resizable,scrollbars');" href="#"><img valign="absmiddle" height="16" width="16" border="0" src="/olcweb/styles/shared/linkicons/image.gif"> (20.0K)</a>
Refer to the diagram. Assume that wages are initially set on the basis of price level P1 and that the economy is operating at its full-employment level of Qf. The short-run effect of an increase in demand is best reflected by a move from: |
|  | A) | point e to point g. |
|  | B) | point e to point b. |
|  | C) | point e to point a. |
|  | D) | point e to point c. |
|
|
 |
| 3 |  | 
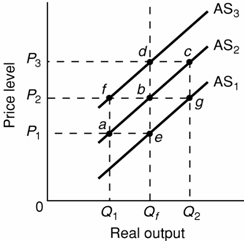
Answer the next question on the basis of the following diagram:
 <a onClick="window.open('/olcweb/cgi/pluginpop.cgi?it=jpg::::/sites/dl/free/0077337727/883763/ch35_q3.jpg','popWin', 'width=NaN,height=NaN,resizable,scrollbars');" href="#"><img valign="absmiddle" height="16" width="16" border="0" src="/olcweb/styles/shared/linkicons/image.gif"> (20.0K)</a> <a onClick="window.open('/olcweb/cgi/pluginpop.cgi?it=jpg::::/sites/dl/free/0077337727/883763/ch35_q3.jpg','popWin', 'width=NaN,height=NaN,resizable,scrollbars');" href="#"><img valign="absmiddle" height="16" width="16" border="0" src="/olcweb/styles/shared/linkicons/image.gif"> (20.0K)</a>
Refer to the diagram. If P1 is the price level and Qf is the full-employment output, then the long-run aggregate supply curve: |
|  | A) | is AS1. |
|  | B) | is AS2. |
|  | C) | connects points a and e. |
|  | D) | connects points e, b, and d. |
|
|
 |
| 4 |  | 
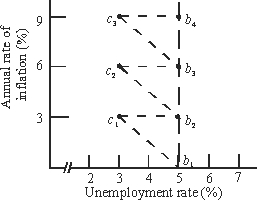
Answer the next question on the basis of the following diagram:
 <a onClick="window.open('/olcweb/cgi/pluginpop.cgi?it=jpg::::/sites/dl/free/0077337727/883763/ch35_q4.jpg','popWin', 'width=NaN,height=NaN,resizable,scrollbars');" href="#"><img valign="absmiddle" height="16" width="16" border="0" src="/olcweb/styles/shared/linkicons/image.gif"> (16.0K)</a> <a onClick="window.open('/olcweb/cgi/pluginpop.cgi?it=jpg::::/sites/dl/free/0077337727/883763/ch35_q4.jpg','popWin', 'width=NaN,height=NaN,resizable,scrollbars');" href="#"><img valign="absmiddle" height="16" width="16" border="0" src="/olcweb/styles/shared/linkicons/image.gif"> (16.0K)</a>
Refer to the diagram. Assume the economy is initially at point b2. In the short run, an increase in aggregate demand will initially move the economy from point b2 to point: |
|  | A) | b1. |
|  | B) | b3. |
|  | C) | c1. |
|  | D) | c2. |
|
|
 |
| 5 |  | 
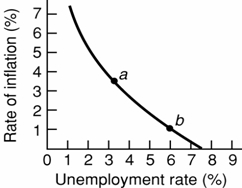
Answer the next question on the basis of the following diagram.
 <a onClick="window.open('/olcweb/cgi/pluginpop.cgi?it=jpg::::/sites/dl/free/0077337727/883763/ch35_q5.jpg','popWin', 'width=NaN,height=NaN,resizable,scrollbars');" href="#"><img valign="absmiddle" height="16" width="16" border="0" src="/olcweb/styles/shared/linkicons/image.gif"> (17.0K)</a> <a onClick="window.open('/olcweb/cgi/pluginpop.cgi?it=jpg::::/sites/dl/free/0077337727/883763/ch35_q5.jpg','popWin', 'width=NaN,height=NaN,resizable,scrollbars');" href="#"><img valign="absmiddle" height="16" width="16" border="0" src="/olcweb/styles/shared/linkicons/image.gif"> (17.0K)</a>
Refer to the diagram. Stagflation would be represented by: |
|  | A) | a movement along the curve from point a to point b. |
|  | B) | a movement along the curve from point b to point a. |
|  | C) | a rightward shift of the curve. |
|  | D) | a leftward shift of the curve. |
|
|
 |
| 6 |  | 
In order to temporarily reduce the unemployment rate below its natural rate, the government could: |
|  | A) | decrease the rate of inflation below peoples' expectations. |
|  | B) | reduce both the trade deficit and the budget deficit. |
|  | C) | raise marginal tax rates and cut wasteful government spending. |
|  | D) | increase the rate of inflation above peoples' expectations. |
|
|
 |
| 7 |  | 
Use the following diagram to answer the next question.
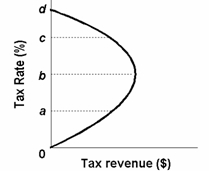 <a onClick="window.open('/olcweb/cgi/pluginpop.cgi?it=jpg::::/sites/dl/free/0077337727/883763/ch35_q7.jpg','popWin', 'width=NaN,height=NaN,resizable,scrollbars');" href="#"><img valign="absmiddle" height="16" width="16" border="0" src="/olcweb/styles/shared/linkicons/image.gif"> (9.0K)</a> <a onClick="window.open('/olcweb/cgi/pluginpop.cgi?it=jpg::::/sites/dl/free/0077337727/883763/ch35_q7.jpg','popWin', 'width=NaN,height=NaN,resizable,scrollbars');" href="#"><img valign="absmiddle" height="16" width="16" border="0" src="/olcweb/styles/shared/linkicons/image.gif"> (9.0K)</a>
Refer to the diagram. If the economy's tax rate is currently set at c, a decrease in the tax rate to b will: |
|  | A) | shift the curve to the right. |
|  | B) | increase total tax revenue. |
|  | C) | increase the size of the deficit. |
|  | D) | shift the aggregate supply curve to the left. |
|
|
 |
| 8 |  | 
Use the following diagram to answer the next question.
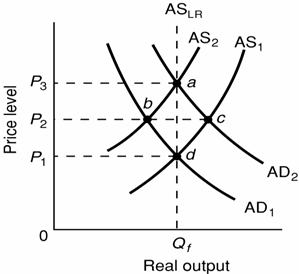 <a onClick="window.open('/olcweb/cgi/pluginpop.cgi?it=jpg::::/sites/dl/free/0077337727/883763/ch35_q8.jpg','popWin', 'width=NaN,height=NaN,resizable,scrollbars');" href="#"><img valign="absmiddle" height="16" width="16" border="0" src="/olcweb/styles/shared/linkicons/image.gif"> (25.0K)</a> <a onClick="window.open('/olcweb/cgi/pluginpop.cgi?it=jpg::::/sites/dl/free/0077337727/883763/ch35_q8.jpg','popWin', 'width=NaN,height=NaN,resizable,scrollbars');" href="#"><img valign="absmiddle" height="16" width="16" border="0" src="/olcweb/styles/shared/linkicons/image.gif"> (25.0K)</a>
Refer to the diagram. Suppose the economy is initially at the full-employment output and price level represented by point d. The path that best represents the economy's response to an expansionary monetary policy is the move from point d to: |
|  | A) | point c to point b. |
|  | B) | point b to point d. |
|  | C) | point c to point a. |
|  | D) | point c to point b to point a. |
|
|
 |
| 9 |  | 
If an adverse supply shock initiates an episode of cost-push inflation and the government does nothing in response, there will likely be: |
|  | A) | an increase in real GDP in the short run but not the long run. |
|  | B) | an inflationary spiral. |
|  | C) | a recession. |
|  | D) | a decrease in aggregate demand. |
|
|
 |
| 10 |  | 
If aggregate demand increases at a faster rate than long-run aggregate supply: |
|  | A) | the economy will enter a recession. |
|  | B) | the production possibilities curve will shift to the left. |
|  | C) | there will be upward pressure on the price level. |
|  | D) | the Fed will be tempted to lower interest rates. |
|
|

