(See related pages)
1. Compare the elasticity of the monopolistically competitor's demand curve with that of a pure competitor and a pure monopolist. Assuming identical long run costs, compare graphically the prices and output that would result in the long run under pure competition and under monopolistic competition. Contrast the two market structures in terms of productive and allocative efficiency. Explain: "Monopolistically competitive industries are characterized by too many firms, each of which produces too little." 2. Answer the following questions, which relate to measures of concentration:.
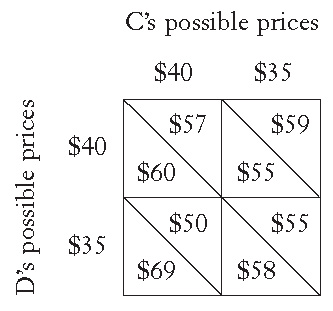
3. Explain the general meaning of the following profit payoff matrix for oligopolists C and D. All profit figures are in thousands.
 4. What assumptions about a rival's response to price changes underlie the kinked-demand curve for oligopolists? Why is there a gap in the oligopolist's marginal-revenue curve? How does the kinked demand curve explain price rigidity in oligopoly? What are the shortcomings of the kinked-demand model? 5. Why is there so much advertising in monopolistic competition and oligopoly? How does such advertising help consumers and promote efficiency? Why might it be excessive at times? |