 |
| 1 |  | 
Monopolistic competition and oligopoly share which characteristic? |
|  | A) | Free entry and exit from the industry |
|  | B) | strategic behavior |
|  | C) | standardized products |
|  | D) | advertising |
|
|
 |
| 2 |  | 
Cartels are more difficult to sustain: |
|  | A) | the smaller the number of firms in the cartel |
|  | B) | the more similar their cost structures |
|  | C) | the more difficult for new firms to enter into the industry |
|  | D) | during a recession |
|
|
 |
| 3 |  | 
Compared to a purely competitive firm with the same cost structure, a monopolistically competitive firm will typically: |
|  | A) | achieve only allocative efficiency |
|  | B) | achieve only productive efficiency |
|  | C) | produce less and charge a higher price |
|  | D) | produce more and charge a lower price |
|
|
 |
| 4 |  | 
Firms in purely competitive markets differ from those in monopolistically competitive markets in that only the latter: |
|  | A) | achieve allocative efficiency |
|  | B) | produce with excess capacity in long-run equilibrium |
|  | C) | equate marginal revenue and marginal cost to maximize profits |
|  | D) | can freely enter the industry |
|
|
 |
| 5 |  | 
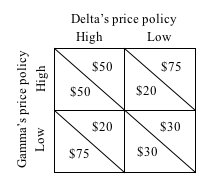
Use the following payoff matrix to answer the next question.
 <a onClick="window.open('/olcweb/cgi/pluginpop.cgi?it=jpg::::/sites/dl/free/1113273090/384259/quiz23c_5.jpg','popWin', 'width=NaN,height=NaN,resizable,scrollbars');" href="#"><img valign="absmiddle" height="16" width="16" border="0" src="/olcweb/styles/shared/linkicons/image.gif"> (10.0K)</a> <a onClick="window.open('/olcweb/cgi/pluginpop.cgi?it=jpg::::/sites/dl/free/1113273090/384259/quiz23c_5.jpg','popWin', 'width=NaN,height=NaN,resizable,scrollbars');" href="#"><img valign="absmiddle" height="16" width="16" border="0" src="/olcweb/styles/shared/linkicons/image.gif"> (10.0K)</a>
Refer to the matrix, which shows the profit payoffs to each of two oligopolistic firms of following either a high or low price policy. Gamma's payoffs are in the lower left corner of each cell; Delta's in the upper right. If both firms collude to maximize joint profits, the combined profits of the two firms will be: |
|  | A) | $40 |
|  | B) | $60 |
|  | C) | $95 |
|  | D) | $100 |
|
|
 |
| 6 |  | 
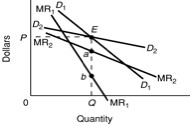
Use the following diagram of a noncollusive oligopolist to answer the next question:
 <a onClick="window.open('/olcweb/cgi/pluginpop.cgi?it=jpg::::/sites/dl/free/1113273090/384259/quiz23c_6.jpg','popWin', 'width=NaN,height=NaN,resizable,scrollbars');" href="#"><img valign="absmiddle" height="16" width="16" border="0" src="/olcweb/styles/shared/linkicons/image.gif"> (5.0K)</a> <a onClick="window.open('/olcweb/cgi/pluginpop.cgi?it=jpg::::/sites/dl/free/1113273090/384259/quiz23c_6.jpg','popWin', 'width=NaN,height=NaN,resizable,scrollbars');" href="#"><img valign="absmiddle" height="16" width="16" border="0" src="/olcweb/styles/shared/linkicons/image.gif"> (5.0K)</a>
Refer to the diagram. The demand curve labeled D2 is drawn on the assumption that this firm's rivals: |
|  | A) | follow both price increases and decreases |
|  | B) | follow neither price increases nor decreases |
|  | C) | follow only price increases |
|  | D) | follow only price decreases |
|
|
 |
| 7 |  | 
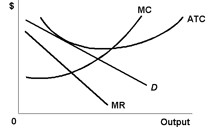
Use the following diagram of a monopolistically competitive firm to answer the next question.
 <a onClick="window.open('/olcweb/cgi/pluginpop.cgi?it=jpg::::/sites/dl/free/1113273090/384259/quiz23c_7.jpg','popWin', 'width=NaN,height=NaN,resizable,scrollbars');" href="#"><img valign="absmiddle" height="16" width="16" border="0" src="/olcweb/styles/shared/linkicons/image.gif"> (5.0K)</a> <a onClick="window.open('/olcweb/cgi/pluginpop.cgi?it=jpg::::/sites/dl/free/1113273090/384259/quiz23c_7.jpg','popWin', 'width=NaN,height=NaN,resizable,scrollbars');" href="#"><img valign="absmiddle" height="16" width="16" border="0" src="/olcweb/styles/shared/linkicons/image.gif"> (5.0K)</a>
Refer to the diagram. Suppose the demand for this industry's product increases, shifting each firm's demand curve to the right. In the long run, we would expect: |
|  | A) | entry of new firms, shifting up the average total cost curve of each original firm to restore equilibrium |
|  | B) | entry of new firms, shifting back the demand curve for each original firm to restore equilibrium |
|  | C) | exit of some firms, shifting back the demand curve for each original firm to restore equilibrium |
|  | D) | exit of some firms, shifting up the average total cost curve of each original firm to restore equilibrium |
|
|
 |
| 8 |  | 
In an oligopolistic industry: |
|  | A) | firms behave strategically |
|  | B) | output is produced at minimum average total cost |
|  | C) | firms make price and output decisions without regard to the responses of their rivals |
|  | D) | high profits will attract many new entrants to the industry |
|
|
 |
| 9 |  | 
A particular industry consists of three firms whose market shares are 50%, 30%, and 20%. The Herfindahl index for the industry is: |
|  | A) | 33.3 |
|  | B) | 100 |
|  | C) | 2400 |
|  | D) | 3800 |
|
|
 |
| 10 |  | 
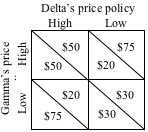
Use the following payoff matrix to answer the next question.
 <a onClick="window.open('/olcweb/cgi/pluginpop.cgi?it=jpg::::/sites/dl/free/1113273090/384259/quiz23c_10.jpg','popWin', 'width=NaN,height=NaN,resizable,scrollbars');" href="#"><img valign="absmiddle" height="16" width="16" border="0" src="/olcweb/styles/shared/linkicons/image.gif"> (8.0K)</a> <a onClick="window.open('/olcweb/cgi/pluginpop.cgi?it=jpg::::/sites/dl/free/1113273090/384259/quiz23c_10.jpg','popWin', 'width=NaN,height=NaN,resizable,scrollbars');" href="#"><img valign="absmiddle" height="16" width="16" border="0" src="/olcweb/styles/shared/linkicons/image.gif"> (8.0K)</a>
Refer to the matrix, which shows the profit payoffs to each of two oligopolistic firms of following either a high or low price policy. Gamma's payoffs are in the lower left corner of each cell; Delta's in the upper right. If both firms make their decisions independently, the most likely outcome is: |
|  | A) | $50 for both Gamma and Delta |
|  | B) | $30 for both Gamma and Delta |
|  | C) | $75 for Gamma and $20 for Delta |
|  | D) | $20 for Gamma and $75 for Delta |
|
|

