 |
| 1 | |
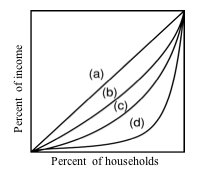
Use the following diagram to answer the next question.
 <a onClick="window.open('/olcweb/cgi/pluginpop.cgi?it=jpg::::/sites/dl/free/1113273090/384260/quiz32a_1.jpg','popWin', 'width=NaN,height=NaN,resizable,scrollbars');" href="#"><img valign="absmiddle" height="16" width="16" border="0" src="/olcweb/styles/shared/linkicons/image.gif"> (8.0K)</a> <a onClick="window.open('/olcweb/cgi/pluginpop.cgi?it=jpg::::/sites/dl/free/1113273090/384260/quiz32a_1.jpg','popWin', 'width=NaN,height=NaN,resizable,scrollbars');" href="#"><img valign="absmiddle" height="16" width="16" border="0" src="/olcweb/styles/shared/linkicons/image.gif"> (8.0K)</a>
Refer to the diagram. If curve c represents the Lorenz curve for annual income, the Lorenz curve for lifetime income is best represented by: |
| | A) | reflecting little lifetime income mobility |
| | B) | reflecting substantial lifetime income mobility |
| | C) | reflecting no lifetime income mobility |
| | D) | reflecting substantial lifetime income mobility |
|
|
|
| 2 | |
The poverty rates for whites and non-whites are approximately equal. |
| | A) | True |
| | B) | False |
|
|
|
| 3 | |
 <a onClick="window.open('/olcweb/cgi/pluginpop.cgi?it=jpg::::/sites/dl/free/1113273090/384260/quiz32a_3.jpg','popWin', 'width=NaN,height=NaN,resizable,scrollbars');" href="#"><img valign="absmiddle" height="16" width="16" border="0" src="/olcweb/styles/shared/linkicons/image.gif"> (8.0K)</a> <a onClick="window.open('/olcweb/cgi/pluginpop.cgi?it=jpg::::/sites/dl/free/1113273090/384260/quiz32a_3.jpg','popWin', 'width=NaN,height=NaN,resizable,scrollbars');" href="#"><img valign="absmiddle" height="16" width="16" border="0" src="/olcweb/styles/shared/linkicons/image.gif"> (8.0K)</a>
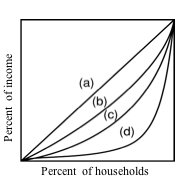
Refer to the diagram. Which of the Lorenz curves in the diagram corresponds to the largest Gini ratio? |
| | A) | a |
| | B) | b |
| | C) | c |
| | D) | d |
|
|
|
| 4 | |
All of the following have contributed to increased income inequality since 1970 except: |
| | A) | a reduction in immigration |
| | B) | an increase in the demand for skilled workers |
| | C) | an increase in international competition |
| | D) | an increase in the number of households headed by single or divorced women |
|
|
|
| 5 | |
Some observers claim that poverty rates are actually higher than officially measured, noting that: |
| | A) | most poor persons are lifted out of poverty by government income-redistribution programs |
| | B) | poverty is measured by consumption, not by income |
| | C) | many persons just above the poverty level live in high cost-of-living urban areas |
| | D) | poverty levels are based on compensation, which includes fringe benefits, rather than income |
|
|
|
| 6 | |
The 1996 welfare reform removed a negligible fraction of the population from the welfare rolls; almost all of the reduction was due to a strong economy in the late 1990s. |
| | A) | True |
| | B) | False |
|
|
|
| 7 | |
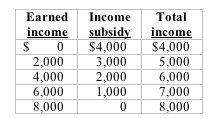
Use the following information regarding an income maintenance plan to answer the next question.
 <a onClick="window.open('/olcweb/cgi/pluginpop.cgi?it=jpg::::/sites/dl/free/1113273090/384260/quiz32a_7.jpg','popWin', 'width=NaN,height=NaN,resizable,scrollbars');" href="#"><img valign="absmiddle" height="16" width="16" border="0" src="/olcweb/styles/shared/linkicons/image.gif"> (9.0K)</a> <a onClick="window.open('/olcweb/cgi/pluginpop.cgi?it=jpg::::/sites/dl/free/1113273090/384260/quiz32a_7.jpg','popWin', 'width=NaN,height=NaN,resizable,scrollbars');" href="#"><img valign="absmiddle" height="16" width="16" border="0" src="/olcweb/styles/shared/linkicons/image.gif"> (9.0K)</a>
Refer to the table. The benefit-reduction rate associated with this plan is: |
| | A) | 100% |
| | B) | 75% |
| | C) | 50% |
| | D) | 25% |
|
|
|
| 8 | |
Use the following information regarding an income maintenance plan to answer the next question.
 <a onClick="window.open('/olcweb/cgi/pluginpop.cgi?it=jpg::::/sites/dl/free/1113273090/384260/quiz32a_8.jpg','popWin', 'width=NaN,height=NaN,resizable,scrollbars');" href="#"><img valign="absmiddle" height="16" width="16" border="0" src="/olcweb/styles/shared/linkicons/image.gif"> (9.0K)</a> <a onClick="window.open('/olcweb/cgi/pluginpop.cgi?it=jpg::::/sites/dl/free/1113273090/384260/quiz32a_8.jpg','popWin', 'width=NaN,height=NaN,resizable,scrollbars');" href="#"><img valign="absmiddle" height="16" width="16" border="0" src="/olcweb/styles/shared/linkicons/image.gif"> (9.0K)</a>
Refer to the table. According to the plan, the minimum annual income is: |
| | A) | $4,000 and the break-even income is $8,000 |
| | B) | $0 and the break-even income is $4,000 |
| | C) | $0 and the break-even income is $8,000 |
| | D) | $4,000 and the break-even income is $4,000 |
|
|
|
| 9 | |
Since 1970, the U.S. distribution of income has: |
| | A) | remained essentially the same, although the distribution of wealth has become substantially more unequal |
| | B) | exhibited a substantial decrease in income mobility |
| | C) | showed a movement away from inequality owing to the falling returns from education |
| | D) | become more unequal, partly owing to increased demand for highly skilled workers |
|
|
|
| 10 | |
In 2004, the share of income accruing to households in the bottom quintile was: |
| | A) | less than 1% |
| | B) | between 3% and 4% |
| | C) | larger than it was in 1970 |
| | D) | corresponds to all households whose incomes are less than $12,000 |
|
|