 |
| 1 | |
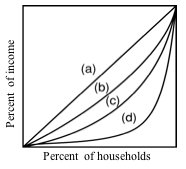
Use the following diagram to answer the next question.
 <a onClick="window.open('/olcweb/cgi/pluginpop.cgi?it=jpg::::/sites/dl/free/1113273090/384260/quiz32b_1.jpg','popWin', 'width=NaN,height=NaN,resizable,scrollbars');" href="#"><img valign="absmiddle" height="16" width="16" border="0" src="/olcweb/styles/shared/linkicons/image.gif"> (8.0K)</a> <a onClick="window.open('/olcweb/cgi/pluginpop.cgi?it=jpg::::/sites/dl/free/1113273090/384260/quiz32b_1.jpg','popWin', 'width=NaN,height=NaN,resizable,scrollbars');" href="#"><img valign="absmiddle" height="16" width="16" border="0" src="/olcweb/styles/shared/linkicons/image.gif"> (8.0K)</a>
Refer to the diagram. The curves (a) through (d) shown in the diagram are known as: |
| | A) | income curves |
| | B) | Gini curves |
| | C) | Lorenz curves |
| | D) | level curves |
|
|
|
| 2 | |
Suppose an economy consists of only five households, whose incomes are $10,000, $15,000, $25,000, $50,000, and $100,000 respectively. If these data were plotted as a Lorenz curve, what percent of income would correspond to the lowest 60% of households? |
| | A) | .125% |
| | B) | 12.5% |
| | C) | 25% |
| | D) | 40% |
|
|
|
| 3 | |
Suppose a public assistance plan provides a minimum annual income of $10,000 and a 40% benefit-reduction rate. The break-even level of income for this plan is: |
| | A) | $20,000 |
| | B) | $25,000 |
| | C) | $40,000 |
| | D) | $50,000 |
|
|
|
| 4 | |
In 2004, approximately how much income was required for a household to reach the highest quintile? |
| | A) | $48,000 |
| | B) | $88,000 |
| | C) | $176,000 |
| | D) | $475,000 |
|
|
|
| 5 | |
The Personal Responsibility Act of 1996 was passed because policy-makers generally agreed that Aid to Families with Dependent Children—the previous welfare system: |
| | A) | provided states insufficient funds to combat poverty |
| | B) | was too heavily dependent on in-kind benefits rather than cash benefits |
| | C) | punished children for their parents' inability to find employment |
| | D) | reduced work incentives and created welfare dependency |
|
|
|
| 6 | |
The quintile distribution of household income: |
| | A) | refers to the amount of income received by groups of 500 households |
| | B) | refers to the number of households receiving one-fifth of total income |
| | C) | refers to the percentage of total income received by one-fifth of the households |
| | D) | is more unequal than the quintile distribution of household wealth |
|
|
|
| 7 | |
"Social Security" is the collective name given to all the social insurance programs available in the U.S., including Temporary Assistance to Needy Families, Unemployment Insurance, Food Stamps, and Medicaid. |
| | A) | True |
| | B) | False |
|
|
|
| 8 | |
One can make a case for redistributing income on economic efficiency grounds by arguing that: |
| | A) | the total utility of income for the rich exceeds that of the poor |
| | B) | the marginal utility of income for the poor exceeds that of the rich |
| | C) | income redistribution increases the incentives to work |
| | D) | income redistribution helps to fill up poor persons' leaky buckets |
|
|
|
| 9 | |
The distribution of wealth in the U.S.: |
| | A) | contributes to inequality of income |
| | B) | has a Gini ratio smaller than that of the distribution of income |
| | C) | has become less unequal over the past 50 years |
| | D) | is the same as the distribution of income |
|
|
|
| 10 | |
All else equal, a public assistance plan's work incentives will be stronger, the: |
| | A) | higher the minimum annual income |
| | B) | lower the break-even income |
| | C) | lower the benefit-reduction rate |
| | D) | greater the number of "tax brackets" |
|
|