 |
| 1 |  | 
Price-taking behavior is a feature of: |
|  | A) | pure competition |
|  | B) | monopolistic competition |
|  | C) | oligopoly |
|  | D) | monopoly |
|
|
 |
| 2 |  | 
Oscar is one of many farmers growing soybeans in the upper Midwest under purely competitive market conditions. As Oscar perceives it, the demand curve for Oscar's soybeans: |
|  | A) | is downward sloping |
|  | B) | is perfectly inelastic |
|  | C) | coincides with Oscar's marginal revenue curve |
|  | D) | lies above his marginal revenue curve |
|
|
 |
| 3 |  | 
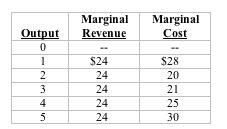
Use the following data to answer the next question.
 <a onClick="window.open('/olcweb/cgi/pluginpop.cgi?it=jpg::::/sites/dl/free/1113273090/384258/quiz21c_3.jpg','popWin', 'width=NaN,height=NaN,resizable,scrollbars');" href="#"><img valign="absmiddle" height="16" width="16" border="0" src="/olcweb/styles/shared/linkicons/image.gif"> (8.0K)</a> <a onClick="window.open('/olcweb/cgi/pluginpop.cgi?it=jpg::::/sites/dl/free/1113273090/384258/quiz21c_3.jpg','popWin', 'width=NaN,height=NaN,resizable,scrollbars');" href="#"><img valign="absmiddle" height="16" width="16" border="0" src="/olcweb/styles/shared/linkicons/image.gif"> (8.0K)</a>
Refer to the table. Suppose the firm's goal is maximum profits (or minimum losses.) If this firm's minimum average variable cost is $23, the firm will produce: |
|  | A) | 0 units |
|  | B) | 2 units |
|  | C) | 3 units |
|  | D) | 4 units |
|
|
 |
| 4 |  | 
Answer the next question on the basis of the following cost data for a competitive firm.
 <a onClick="window.open('/olcweb/cgi/pluginpop.cgi?it=jpg::::/sites/dl/free/1113273090/384258/quiz21c_3.jpg','popWin', 'width=NaN,height=NaN,resizable,scrollbars');" href="#"><img valign="absmiddle" height="16" width="16" border="0" src="/olcweb/styles/shared/linkicons/image.gif"> (8.0K)</a> <a onClick="window.open('/olcweb/cgi/pluginpop.cgi?it=jpg::::/sites/dl/free/1113273090/384258/quiz21c_3.jpg','popWin', 'width=NaN,height=NaN,resizable,scrollbars');" href="#"><img valign="absmiddle" height="16" width="16" border="0" src="/olcweb/styles/shared/linkicons/image.gif"> (8.0K)</a>
Refer to the above data. If the market price is $50 and the firm produces its optimal amount, it will: |
|  | A) | realize a $15 profit |
|  | B) | realize a $80 profit |
|  | C) | realize a $90 profit |
|  | D) | incur a $15 loss |
|
|
 |
| 5 |  | 
A competitive firm is currently producing 2000 units per month at a total cost of $12,000. Its fixed costs are $1,000 and its marginal cost is $5. If the market price is $5.60, this firm: |
|  | A) | should shut down |
|  | B) | should increase production |
|  | C) | is making an economic profit, but not an accounting profit |
|  | D) | is maximizing profits |
|
|
 |
| 6 |  | 
A purely competitive firm's output is currently such that its marginal cost is $225 and rising. Its marginal revenue is $210. Assuming profit maximization, this firm should: |
|  | A) | cut its price and increase production |
|  | B) | raise its price and cut production |
|  | C) | cut its price and cut production |
|  | D) | leave price unchanged and cut production |
|
|
 |
| 7 |  | 
For all values above minimum average variable cost, a competitive firm's: |
|  | A) | supply curve is coincident with its marginal cost curve |
|  | B) | supply curve is coincident with its average total cost curve |
|  | C) | demand curve is coincident with its average total cost curve |
|  | D) | demand curve is coincident with its supply curve |
|
|
 |
| 8 |  | 
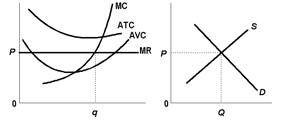
Use the following diagrams to answer the next question.
 <a onClick="window.open('/olcweb/cgi/pluginpop.cgi?it=jpg::::/sites/dl/free/1113273090/384258/quiz21c_8.jpg','popWin', 'width=NaN,height=NaN,resizable,scrollbars');" href="#"><img valign="absmiddle" height="16" width="16" border="0" src="/olcweb/styles/shared/linkicons/image.gif"> (6.0K)</a> <a onClick="window.open('/olcweb/cgi/pluginpop.cgi?it=jpg::::/sites/dl/free/1113273090/384258/quiz21c_8.jpg','popWin', 'width=NaN,height=NaN,resizable,scrollbars');" href="#"><img valign="absmiddle" height="16" width="16" border="0" src="/olcweb/styles/shared/linkicons/image.gif"> (6.0K)</a>
Refer to the above diagrams, which pertain to a purely competitive firm and the industry in which it operates. In the long run we should expect: |
|  | A) | new firms to enter, market demand to rise, and price to fall |
|  | B) | demand to increase, and price to rise |
|  | C) | input prices to fall, supply to increase, and price to fall |
|  | D) | exit of some firms, supply to decrease, and price to rise |
|
|
 |
| 9 |  | 
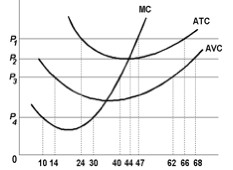
Use the following diagram to answer the next question.
 <a onClick="window.open('/olcweb/cgi/pluginpop.cgi?it=jpg::::/sites/dl/free/1113273090/384261/quiz21c_9.jpg','popWin', 'width=NaN,height=NaN,resizable,scrollbars');" href="#"><img valign="absmiddle" height="16" width="16" border="0" src="/olcweb/styles/shared/linkicons/image.gif"> (9.0K)</a> <a onClick="window.open('/olcweb/cgi/pluginpop.cgi?it=jpg::::/sites/dl/free/1113273090/384261/quiz21c_9.jpg','popWin', 'width=NaN,height=NaN,resizable,scrollbars');" href="#"><img valign="absmiddle" height="16" width="16" border="0" src="/olcweb/styles/shared/linkicons/image.gif"> (9.0K)</a>
Which one of the following price-quantity combinations is not on this competitive firm's short-run supply curve? |
|  | A) | P1, 47 |
|  | B) | P2, 44 |
|  | C) | P3, 40 |
|  | D) | P4, 30 |
|
|
 |
| 10 |  | 
In the long run, competitive markets achieve: |
|  | A) | allocative efficiency because P = min ATC but not productive efficiency because P > min AVC |
|  | B) | allocative efficiency because P = MC and productive efficiency because P = min ATC |
|  | C) | productive efficiency because P = min ATC but not allocative efficiency because P > MR |
|  | D) | neither productive nor allocative efficiency |
|
|

