 |
1 | |
Which of these is a primary source of data? |
| | A) | The manager of a department store interviews every tenth customer for comments on the new store layout. |
| | B) | A salesperson at a department store searches the Statistics Canada web site for economic data on the population living around the store. |
| | C) | Both of these are primary sources. |
| | D) | Neither of these is a primary source. |
|
|
2 | |
In order to determine the opinions of citizens concerning a proposed new sports complex to be built in a town, the mayor set up a desk at the local mall, and interviewed those who stopped by the desk. This kind of sampling is: |
| | A) | Simple random sampling. |
| | B) | Stratified random sampling. |
| | C) | Systematic random sampling. |
| | D) | Non-random sampling. |
|
|
3 | |
Kumar asked ten students in his class to record how much each spent on buying lunches in the school cafeteria over one month. This data is best represented using |
| | A) | A frequency table. |
| | B) | A bar graph. |
| | C) | A broken-line graph. |
| | D) | Any of these are suitable. |
|
|
4 | |
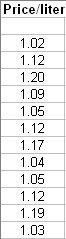
Seymour noted the price of aviation gasoline at various airports during a flight across Canada. The data are shown. Find the mean of these data
 <a onClick="window.open('/olcweb/cgi/pluginpop.cgi?it=jpg::::/sites/dl/free/007092242x/118753/MACT9_CH04_Q4.jpg','popWin', 'width=NaN,height=NaN,resizable,scrollbars');" href="#"><img valign="absmiddle" height="16" width="16" border="0" src="/olcweb/styles/shared/linkicons/image.gif"> (7.0K)</a> <a onClick="window.open('/olcweb/cgi/pluginpop.cgi?it=jpg::::/sites/dl/free/007092242x/118753/MACT9_CH04_Q4.jpg','popWin', 'width=NaN,height=NaN,resizable,scrollbars');" href="#"><img valign="absmiddle" height="16" width="16" border="0" src="/olcweb/styles/shared/linkicons/image.gif"> (7.0K)</a> |
| | A) | 1.12 |
| | B) | 1.11 |
| | C) | 1.10 |
| | D) | 1.09 |
|
|
5 | |
Find the median price of aviation gasoline in question 4. |
| | A) | 1.12 |
| | B) | 1.11 |
| | C) | 1.10 |
| | D) | 1.09 |
|
|
6 | |
Find the mode of the prices in question 4. |
| | A) | 1.12 |
| | B) | 1.11 |
| | C) | 1.10 |
| | D) | 1.09 |
|
|
7 | |
The data in question 4 have two outliers in the form of 1.19 and 1.20. The effect of these outliers is: |
| | A) | The mean is lower. |
| | B) | The mean is higher. |
| | C) | The median is lower. |
| | D) | The median is higher. |
|
|
8 | |
An outlier which is lower in value than the mode tends to |
| | A) | Increase the value of the mode. |
| | B) | Decrease the value of the mode. |
| | C) | Have no effect on the mode. |
| | D) | Change the mode to a different but unpredictable value. |
|
|
9 | |
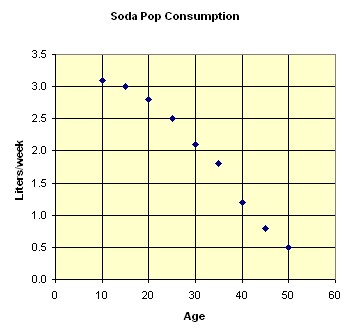
The scatter plot shown relates age to the average amount of soda pop consumed per week. From this scatter plot, what relation appears evident?
 <a onClick="window.open('/olcweb/cgi/pluginpop.cgi?it=jpg::::/sites/dl/free/007092242x/118753/MACT9_CH04_Q9.jpg','popWin', 'width=NaN,height=NaN,resizable,scrollbars');" href="#"><img valign="absmiddle" height="16" width="16" border="0" src="/olcweb/styles/shared/linkicons/image.gif"> (16.0K)</a> <a onClick="window.open('/olcweb/cgi/pluginpop.cgi?it=jpg::::/sites/dl/free/007092242x/118753/MACT9_CH04_Q9.jpg','popWin', 'width=NaN,height=NaN,resizable,scrollbars');" href="#"><img valign="absmiddle" height="16" width="16" border="0" src="/olcweb/styles/shared/linkicons/image.gif"> (16.0K)</a> |
| | A) | There is no relation between age and amount of soda pop consumed per week. |
| | B) | As age increases, the amount of soda pop consumed per week decreases. |
| | C) | As age increases, the amount of soda pop consumed per week increases. |
| | D) | As age increases, the amount of soda pop consumed per week remains the same. |
|
|
10 | |
Nine visitors to a shopping mall were selected at random. They were asked for their yearly income, to the nearest $1000, and how many visits they had made to the mall during the year. The results are shown in the scatter plot. What relation appears evident?
 <a onClick="window.open('/olcweb/cgi/pluginpop.cgi?it=jpg::::/sites/dl/free/007092242x/118753/MACT9_CH04_Q10.jpg','popWin', 'width=NaN,height=NaN,resizable,scrollbars');" href="#"><img valign="absmiddle" height="16" width="16" border="0" src="/olcweb/styles/shared/linkicons/image.gif"> (19.0K)</a> <a onClick="window.open('/olcweb/cgi/pluginpop.cgi?it=jpg::::/sites/dl/free/007092242x/118753/MACT9_CH04_Q10.jpg','popWin', 'width=NaN,height=NaN,resizable,scrollbars');" href="#"><img valign="absmiddle" height="16" width="16" border="0" src="/olcweb/styles/shared/linkicons/image.gif"> (19.0K)</a> |
| | A) | There is no relation between income and number of mall visits. |
| | B) | As income increases, the number of mall visits increases. |
| | C) | As income increases, the number of mall visits increases. |
| | D) | As income increases, the number of mall visits increases. |
|