Dave Beauvais, Super User: Creating a Two-Input Data
Table Dave is considering buying a car. Currently, he can afford a
$200 car payment and a $500 down payment. He has decided to
create a two-input data table to see how expensive a car he can
purchase based on what kind of rate he can get on a car loan.
Assume the role of Dave and perform the steps that he
identifies. - Open the EX09XTRA01 Excel file.
- Save the file as "Dave’s Car" to your personal
storage location.
- Define a series of possible car prices in cells E1
through J1.
SELECT: cell E1 TYPE: 6000 SELECT: cell F1 TYPE: 7000 - Use the fill handle to complete the series to cell
J1.
SELECT: the cell range from E1 to F1 DRAG: the fill handle to cell J1 or until the ScreenTip
shows "11000,"as shown in Figure 9.1
Figure 9.1 Preparing a two-input data table |  <a onClick="window.open('/olcweb/cgi/pluginpop.cgi?it=gif:: ::/sites/dl/free/0072470941/26807/ECh09_acq_Image1.gif','popWin', 'width=NaN,height=NaN,resizable,scrollbars');" href="#"><img valign="absmiddle" height="16" width="16" border="0" src="/olcweb/styles/shared/linkicons/image.gif"> (24.0K)</a> <a onClick="window.open('/olcweb/cgi/pluginpop.cgi?it=gif:: ::/sites/dl/free/0072470941/26807/ECh09_acq_Image1.gif','popWin', 'width=NaN,height=NaN,resizable,scrollbars');" href="#"><img valign="absmiddle" height="16" width="16" border="0" src="/olcweb/styles/shared/linkicons/image.gif"> (24.0K)</a>
|
- Now, define a set of possible loan rates in cells D3
through D20
SELECT: cell D3 TYPE: 1% SELECT: cell D4 TYPE: 2% Use the fill handle to complete the series to cell D20
or until the ScreeenTip shows "18%" - Now enter a reference to the outcome formula in the top
left-hand corner of the data table:
SELECT: cell D2
TYPE: =b6
PRESS: Enter key - To create the data table:
SELECT: cell range from D2 to J20
CHOOSE: Data, Table
The Table dialog box appears. - On your own, move the Table dialog box so that the input
cells are visible. Then, do the following:
CLICK: in the
Row input cell
text box
CLICK: cell B2
CLICK: in the
Column input cell
text box
CLICK: cell B4 - CLICK: OK command button to proceed
The values for the data table are calculated and then
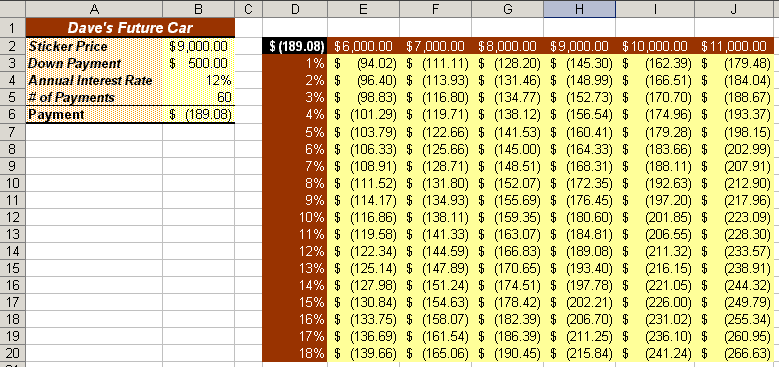
displayed. - On your own, format the data table to appear similar to
Figure 9.2.
Figure 9.2 A two-input data table |  <a onClick="window.open('/olcweb/cgi/pluginpop.cgi?it=gif:: ::/sites/dl/free/0072470941/26807/ECh09_acq_Image3.gif','popWin', 'width=NaN,height=NaN,resizable,scrollbars');" href="#"><img valign="absmiddle" height="16" width="16" border="0" src="/olcweb/styles/shared/linkicons/image.gif"> (25.0K)</a> <a onClick="window.open('/olcweb/cgi/pluginpop.cgi?it=gif:: ::/sites/dl/free/0072470941/26807/ECh09_acq_Image3.gif','popWin', 'width=NaN,height=NaN,resizable,scrollbars');" href="#"><img valign="absmiddle" height="16" width="16" border="0" src="/olcweb/styles/shared/linkicons/image.gif"> (25.0K)</a>
|
- Save and then close the workbook.
Data File:  ex09xtra01 (13.0K) ex09xtra01 (13.0K)
Waxing Nostalgic Records: Using Scenarios
Al Lincoln, the owner of Waxing Nostalgic Records, is
considering raising the price of the used records in his
bargain bin. Based on previous experience, he guesses that he
will lose about 10% of his monthly sales if he raises the price
$1 and about 40% of his monthly sales if he raises the price
$2. He decides to use Excel’s Scenario Manager to help
find what would be best from a profit standpoint. Assume the
role of Al and perform the steps that he identifies. - Open the EX09XTRA02 Excel file.
- Save the worksheet as "Bargain Bin" to your personal
storage location.
- CHOOSE: Tools, Scenarios
The Scenario Manager dialog box appears with a message
stating that no scenarios are yet defined. - To add a new scenario that describes the union’s
demands:
CLICK: Add command button
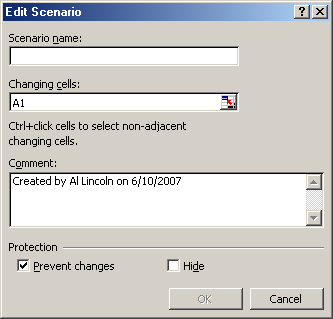
The Add Scenario dialog box appears, as shown in Figure
9.3. Figure 9.3 Add Scenario dialog box |  <a onClick="window.open('/olcweb/cgi/pluginpop.cgi?it=gif:: ::/sites/dl/free/0072470941/26807/ECh09_acq_Image4.gif','popWin', 'width=NaN,height=NaN,resizable,scrollbars');" href="#"><img valign="absmiddle" height="16" width="16" border="0" src="/olcweb/styles/shared/linkicons/image.gif"> (7.0K)</a> <a onClick="window.open('/olcweb/cgi/pluginpop.cgi?it=gif:: ::/sites/dl/free/0072470941/26807/ECh09_acq_Image4.gif','popWin', 'width=NaN,height=NaN,resizable,scrollbars');" href="#"><img valign="absmiddle" height="16" width="16" border="0" src="/olcweb/styles/shared/linkicons/image.gif"> (7.0K)</a>
|
- In the
Scenario name
text box:
TYPE: Raise by $1
PRESS: Tab key - In the
Changing cells
text box, replace the current selection by entering the
following cells:
TYPE: B3,B5 - You must now define the input values for each of the
changing cells:
CLICK: OK command button - To enter the scenario variables:
TYPE: 900 in the
1: NumberSold
text box
PRESS: Tab key
TYPE: 4.00 in the
2: RecordPrice
text box
CLICK: OK command button - To create a second scenario:
CLICK: Add command button
The Add Scenario dialog box reappears. - TYPE: Raise by $2 in the
Scenario name
text box
CLICK: OK command button
The Scenario Values dialog box appears. - Enter the values for the management proposal:
TYPE: 600 in the
1: NumberSold
text box
PRESS: Tab key
TYPE: 5.00 in the
2: RecordPrice
text box - To complete the dialog box:
CLICK: OK command button
The Scenario Manager dialog reappears with two scenarios
called "Raise by $1" and "Raise by $2." - To show the "Raise by $2" scenario:
SELECT: "Raise by $2" in the
Scenarios
list box
CLICK: Show command button - Practice showing the two different scenarios using the
Show command button.
- Save and then close the document.
Data File:  ex09xtra02 (13.0K) ex09xtra02 (13.0K)
Saganaki Motors Computer Help Desk: Creating a
PivotTable
Richard Brown is the head of the Saganaki Motors Computer
Help Desk. His department is required to log all calls so that
the Help Desk services can be billed to individual departments.
In this exercise, Richard will create a PivotTable to summarize
one day’s log sheet. Assume the role of Richard and
perform the steps that he identifies. - Open the EX09XTRA03 Excel file and save it to your
personal storage location as "Help Desk Report".
- Launch the PivotTable and PivotChart Wizard.
- In the wizard, select the options required to create a
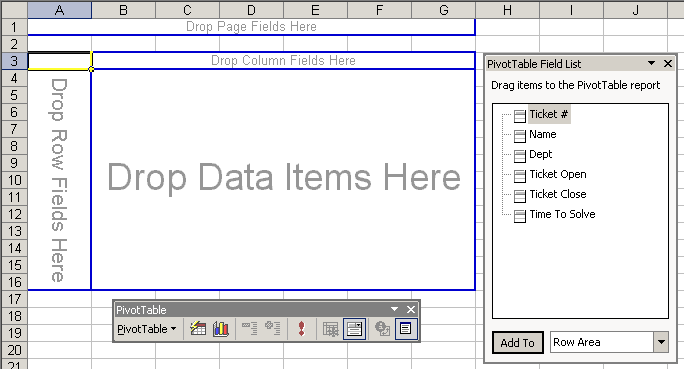
PivotTable report on a new worksheet. Your screen should now
appear similar to Figure 9.4
Figure 9.4 Creating a PivotTable |  <a onClick="window.open('/olcweb/cgi/pluginpop.cgi?it=gif:: ::/sites/dl/free/0072470941/26807/ECh09_acq_Image6.gif','popWin', 'width=NaN,height=NaN,resizable,scrollbars');" href="#"><img valign="absmiddle" height="16" width="16" border="0" src="/olcweb/styles/shared/linkicons/image.gif"> (15.0K)</a> <a onClick="window.open('/olcweb/cgi/pluginpop.cgi?it=gif:: ::/sites/dl/free/0072470941/26807/ECh09_acq_Image6.gif','popWin', 'width=NaN,height=NaN,resizable,scrollbars');" href="#"><img valign="absmiddle" height="16" width="16" border="0" src="/olcweb/styles/shared/linkicons/image.gif"> (15.0K)</a>
|
- Using the PivotTable Field List window, drag the Name
field item to the "Drop Column Fields Here" area. Then, drag
the Dept field item to the "Drop Column Fields Here"
area.
- Drag the Time To Solve field item into the data
area.
- Customize the Time To Solve data field so that the
worksheet shows the sum of Time To Solve. Reformat the Time
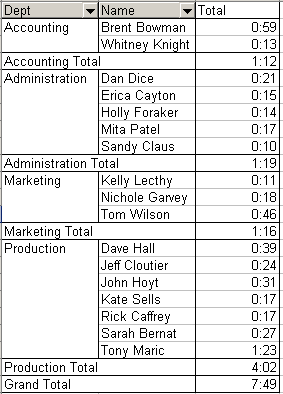
To Solve data cells to a time format. Your PivotTable should
now resemble the one in figure 9.5.
Figure 9.5 Complete PivotTable |  <a onClick="window.open('/olcweb/cgi/pluginpop.cgi?it=gif:: ::/sites/dl/free/0072470941/26807/ECh09_acq_Image7.gif','popWin', 'width=NaN,height=NaN,resizable,scrollbars');" href="#"><img valign="absmiddle" height="16" width="16" border="0" src="/olcweb/styles/shared/linkicons/image.gif"> (6.0K)</a> <a onClick="window.open('/olcweb/cgi/pluginpop.cgi?it=gif:: ::/sites/dl/free/0072470941/26807/ECh09_acq_Image7.gif','popWin', 'width=NaN,height=NaN,resizable,scrollbars');" href="#"><img valign="absmiddle" height="16" width="16" border="0" src="/olcweb/styles/shared/linkicons/image.gif"> (6.0K)</a>
|
- Save and then close the file.
Data File:  ex09xtra03 (25.0K) ex09xtra03 (25.0K) |


 2002 McGraw-Hill Higher Education


