 |
| 1 | |
Agricultural price supports do all of the following except: |
| | A) | increase pollution by encouraging the use of more fertilizer and pesticides |
| | B) | lead to trade barriers to prevent increased imports |
| | C) | hasten the departure of resources from farming |
| | D) | create surpluses of farm products |
|
|
|
| 2 | |
The 1996 Freedom to Farm Act: |
| | A) | ended all agricultural price supports |
| | B) | was partially "undone" by emergency aid payments to farmers beginning in 1998 and 1999 |
| | C) | allowed farmers to plant as much as they desired, but restricted which crops they could plant |
| | D) | increased price supports on grain while removing them from sugar and tobacco |
|
|
|
| 3 | |
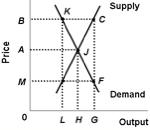
Use the following diagram of the U.S. corn market to answer the next question.
 <a onClick="window.open('/olcweb/cgi/pluginpop.cgi?it=jpg::::/sites/dl/free/1113273090/384260/quiz31b_3.jpg','popWin', 'width=NaN,height=NaN,resizable,scrollbars');" href="#"><img valign="absmiddle" height="16" width="16" border="0" src="/olcweb/styles/shared/linkicons/image.gif"> (9.0K)</a> <a onClick="window.open('/olcweb/cgi/pluginpop.cgi?it=jpg::::/sites/dl/free/1113273090/384260/quiz31b_3.jpg','popWin', 'width=NaN,height=NaN,resizable,scrollbars');" href="#"><img valign="absmiddle" height="16" width="16" border="0" src="/olcweb/styles/shared/linkicons/image.gif"> (9.0K)</a>
Refer to the diagram: Prior to 1996, U.S. farm policy would most likely have: |
| | A) | raised price to B, resulting in a surplus |
| | B) | lowered price to M, resulting in a shortage |
| | C) | lowered price to M, resulting in a surplus |
| | D) | left price at A, reflecting a laissez-faire policy |
|
|
|
| 4 | |
Which of the following changes in the markets for agricultural products best illustrates markets for farm products over the long-run? |
| | A) | Large increases in demand and small increases in supply |
| | B) | Large increases in demand and large increases in supply |
| | C) | Small increases in demand and small increases in supply |
| | D) | Small increases in demand and large increases in supply |
|
|
|
| 5 | |
Government agricultural policy has resulted in a more rapid exodus from farm employment than would otherwise have been the case. |
| | A) | True |
| | B) | False |
|
|
|
| 6 | |
If in a certain year the indices of prices received and paid by farmers were 140 and 200 respectively, the parity ratio would be: |
| | A) | 30 |
| | B) | 60 |
| | C) | 70 |
| | D) | 1.43 |
|
|
|
| 7 | |
Federal government programs such as food stamps and Food for Peace: |
| | A) | increase the supply of food, lowering farm incomes |
| | B) | reduce the supply of food, reducing the surpluses created by price supports |
| | C) | increase the demand for food, reducing the surpluses created by price supports |
| | D) | were phased out by the Freedom to Farm Act of 1996 |
|
|
|
| 8 | |
An increase in the prices paid by farmers coupled with a decrease in the prices they receive will: |
| | A) | reduce the parity ratio |
| | B) | trigger automatic increases in tariffs on imported agricultural products |
| | C) | increase real farm incomes |
| | D) | put political pressure on Congress to reduce farm subsidies |
|
|
|
| 9 | |
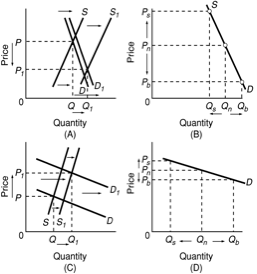
Use the following diagrams to answer the next question.
 <a onClick="window.open('/olcweb/cgi/pluginpop.cgi?it=jpg::::/sites/dl/free/1113273090/384260/quiz31b_9.jpg','popWin', 'width=NaN,height=NaN,resizable,scrollbars');" href="#"><img valign="absmiddle" height="16" width="16" border="0" src="/olcweb/styles/shared/linkicons/image.gif"> (29.0K)</a> <a onClick="window.open('/olcweb/cgi/pluginpop.cgi?it=jpg::::/sites/dl/free/1113273090/384260/quiz31b_9.jpg','popWin', 'width=NaN,height=NaN,resizable,scrollbars');" href="#"><img valign="absmiddle" height="16" width="16" border="0" src="/olcweb/styles/shared/linkicons/image.gif"> (29.0K)</a>
Refer to the diagrams. Which diagram best illustrates the long-run impacts of changes in technology and U.S. population on total farm production and prices? |
| | A) | A |
| | B) | B |
| | C) | C |
| | D) | D |
|
|
|
| 10 | |
Use the following diagrams to answer the next question.
 <a onClick="window.open('/olcweb/cgi/pluginpop.cgi?it=jpg::::/sites/dl/free/1113273090/384260/quiz31b_10.jpg','popWin', 'width=NaN,height=NaN,resizable,scrollbars');" href="#"><img valign="absmiddle" height="16" width="16" border="0" src="/olcweb/styles/shared/linkicons/image.gif"> (27.0K)</a> <a onClick="window.open('/olcweb/cgi/pluginpop.cgi?it=jpg::::/sites/dl/free/1113273090/384260/quiz31b_10.jpg','popWin', 'width=NaN,height=NaN,resizable,scrollbars');" href="#"><img valign="absmiddle" height="16" width="16" border="0" src="/olcweb/styles/shared/linkicons/image.gif"> (27.0K)</a>
Refer to the diagrams. Which diagram best illustrates the dramatic year-to-year swings in farm income? |
| | A) | A |
| | B) | B |
| | C) | C |
| | D) | D |
|
|