 |
| 1 |  | 
Growing world population and incomes have resulted in a growing demand for basic commodities. The evidence suggests that the supply of commodities has grown: |
|  | A) | even faster, resulting in rising commodity prices |
|  | B) | slower, resulting in rising commodity prices |
|  | C) | slower, resulting in falling commodity prices |
|  | D) | even faster, resulting in falling commodity prices |
|
|
 |
| 2 |  | 
Compared to limiting the number of boats allowed to fish in a particular area, a system of individual transferable quotas will likely: |
|  | A) | lead to more intensive fishing by bigger and faster boats |
|  | B) | reduce the overall cost of the total catch |
|  | C) | reduce the number of days the typical boat is out fishing |
|  | D) | increase the size of the total catch |
|
|
 |
| 3 |  | 
Which of the following best exemplifies a renewable resource? |
|  | A) | Pacific cod |
|  | B) | Arizona copper |
|  | C) | Alaska crude oil |
|  | D) | Pennsylvania coal |
|
|
 |
| 4 |  | 
Suppose you own property containing a small vein of copper ore. By mining and selling the copper today, you could get net benefits of $4.00 per pound. Alternatively, you could wait for one year and get net benefits at that time of $4.10 per pound. If the interest rate is 5%, you should: |
|  | A) | mine the copper next year, since the market price may go up even further |
|  | B) | mine the copper next year, since $4.10 exceeds $4.00 |
|  | C) | mine the copper today, since the present value of $4.10 received next year exceeds $4.00 |
|  | D) | mine the copper today, since $4.00 today could be invested and return $4.20 next year |
|
|
 |
| 5 |  | 
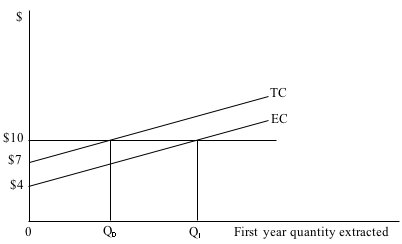
Refer to the following:
 <a onClick="window.open('/olcweb/cgi/pluginpop.cgi?it=jpg::::/sites/dl/free/1113273090/384260/quiz27webc_5.jpg','popWin', 'width=NaN,height=NaN,resizable,scrollbars');" href="#"><img valign="absmiddle" height="16" width="16" border="0" src="/olcweb/styles/shared/linkicons/image.gif"> (0.0K)</a> <a onClick="window.open('/olcweb/cgi/pluginpop.cgi?it=jpg::::/sites/dl/free/1113273090/384260/quiz27webc_5.jpg','popWin', 'width=NaN,height=NaN,resizable,scrollbars');" href="#"><img valign="absmiddle" height="16" width="16" border="0" src="/olcweb/styles/shared/linkicons/image.gif"> (0.0K)</a>
Suppose the current market price of this non-renewable resource is $10. Extraction costs are given by EC and the user cost is $3. In the first year, the firm depicted in the diagram should extract: |
|  | A) | none of this resource, as the total cost of the resource exceeds $10 |
|  | B) | all of this resource, as the user cost is only $3, which is less than the market price |
|  | C) | Q0 units of the resource, as the total cost of extracting units in excess of this amount exceeds the market price |
|  | D) | Q1 units of the resource, as the user cost concept only applies to renewable resources |
|
|
 |
| 6 |  | 
The fundamental trade-off facing small non-renewable extraction companies is: |
|  | A) | the more they extract today, the lower the demand for the resource |
|  | B) | the more they extract today, the less will be available to extract tomorrow |
|  | C) | the more they extract today, the higher the cost of extraction tomorrow |
|  | D) | the less they extract today, the lower the user cost of extraction tomorrow |
|
|
 |
| 7 |  | 
Refer to the following:
 <a onClick="window.open('/olcweb/cgi/pluginpop.cgi?it=jpg::::/sites/dl/free/1113273090/384260/quiz27webc_5.jpg','popWin', 'width=NaN,height=NaN,resizable,scrollbars');" href="#"><img valign="absmiddle" height="16" width="16" border="0" src="/olcweb/styles/shared/linkicons/image.gif"> (0.0K)</a> <a onClick="window.open('/olcweb/cgi/pluginpop.cgi?it=jpg::::/sites/dl/free/1113273090/384260/quiz27webc_5.jpg','popWin', 'width=NaN,height=NaN,resizable,scrollbars');" href="#"><img valign="absmiddle" height="16" width="16" border="0" src="/olcweb/styles/shared/linkicons/image.gif"> (0.0K)</a>
If the graph shows the typical growth pattern of a forest, forest companies will most likely harvest the trees at a time somewhere: |
|  | A) | between 0 and T0 |
|  | B) | between T0 and T1 |
|  | C) | between T1 and T2 |
|  | D) | after T2 |
|
|
 |
| 8 |  | 
Demographers expect the world's population to: |
|  | A) | rise for the next several years, peak at around 9 billion people, then begin to fall |
|  | B) | continue to rise for the foreseeable future |
|  | C) | continue to fall for the foreseeable future |
|  | D) | rise rapidly for the next 200 years, then begin to level off |
|
|
 |
| 9 |  | 
If a firm expects it might lose the property rights to a natural resource it currently controls: |
|  | A) | its user cost will rise and it will decrease its current rate of extraction |
|  | B) | its user cost will fall and it will decrease its current rate of extraction |
|  | C) | its user cost will rise and it will increase its current rate of extraction |
|  | D) | its user cost will fall and it will increase its current rate of extraction |
|
|
 |
| 10 |  | 
Evidence for the U.S. since 1988 indicates that per capita energy usage: |
|  | A) | and per capita GDP have both increased at the same rate, indicating little change in energy efficiency |
|  | B) | has fallen while per capita GDP has increased dramatically, indicating improved energy efficiency |
|  | C) | has increased while per capita GDP has leveled off, indicating a reduction in energy efficiency |
|  | D) | has leveled off while per capita GDP has increased, indicating improved energy efficiency |
|
|

