(See related pages)
Computer-assisted reporting consists of two sets of skills. Jeff South of Virginia Commonwealth University lists them as: Online research: Using the Internet for information for news stories. Data analysis: Using special software, such as spreadsheets, to sort, summarize, combine and do calculations with the data you have gathered. We now will take CAR a step forward and do a data analysis. But first, let South walk you through a data analysis. In this exercise, you will use the most popular spreadsheet program, Microsoft Excel, to do basic analysis of data from the Census Bureau's Web site. Here is where we will get the data: Go to the bureau's Web site (http://www.census.gov), and click on "News Releases." Find the release from Dec. 28, 2000, about the first results from the 2000 census.
At the bottom of the news release is a link to an online press kit. Click on it, and you will see this page:
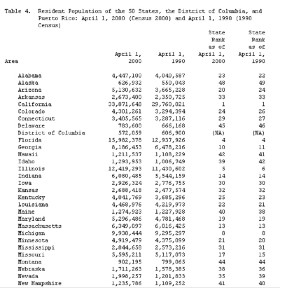
The press kit contains various Census 2000 results: a state-by-state list of resident population for 2000; an "apportionment" list showing how many congressional seats each state would get; and so on. Each set of results is presented in three formats: an ASCII format (plain text—a simple word-processing document); a PDF format (used by Adobe Acrobat—an image-ready document excellent for printing); and an Excel format. If you click on any of the ASCII or PDF documents, they will appear in your Web browser. The big limitation with such files is that they are static: You can't sort or otherwise manipulate the information on your screen. The "State Rankings" table, for example, lists the states in alphabetical order; the ASCII version looks like this:
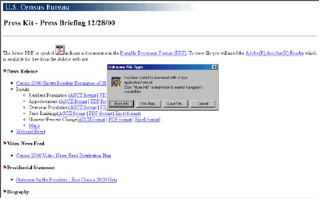
But suppose you want to list the states by population size. And what about calculating the change in population for each state from 1990 to 2000? A Web browser won't do that for you. But a spreadsheet program like Excel will. So click on the link to the Excel format of the state rankings. If your Web browser is Microsoft Internet Explorer, it will automatically launch Excel. If your browser is Netscape Communicator, it will ask whether you want to save the file to your computer:
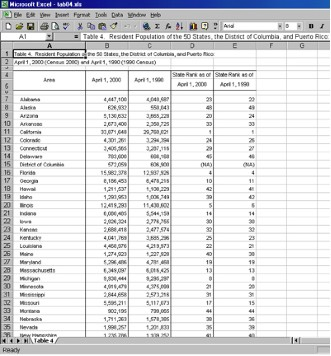
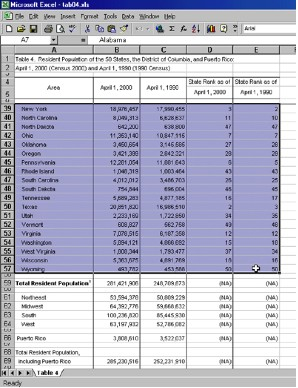
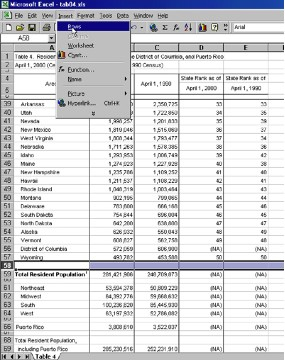
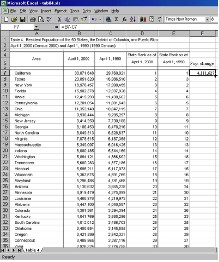
With Netscape, save the file first, then open it in Excel. (A copy of the file is also stored on this disk. It is called "tab04.xls"—the name the Census Bureau gave it, for "table 4.") Here's what the table looks like in Excel:
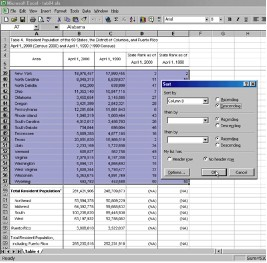
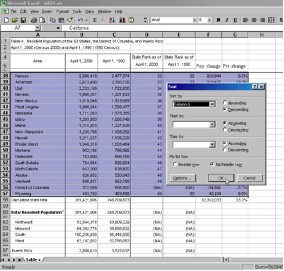
A spreadsheet stores information in a grid of columns and rows. Each rectangle in the grid is called a cell, and every cell has an address: The address of the cell where column A meets row 12 is A12; the address of the cell where column K meets row 481 is K481. This spreadsheet has a title and description in rows 1 and 2; the column headings or labels are in rows 4 and 5; and the actual data—the state-by-state numbers—begin on row 7. If you scroll down, you'll see that the last state—Wyoming—is on row 57; national totals are on row 59; and below that are numbers for regions and Puerto Rico, as well as footnotes about the data. Here are some things we'll do with the data: First, we will sort it to put the most populous states on top. Then, we will add the 2000 state populations—to check the totals on row 59. Then, we will add two new columns of information, showing the absolute change and the percentage change in population for each state. Finally, we will sort the states according to their growth rates. Before we begin, though, we should solve one small problem: As you scroll down on this table, the column headings in rows 4 and 5 disappear. That makes it hard to know which column represents 1990 population data and which column represents 2000. So let's lock the column headings in place. Click on cell A7, the cell containing "Alabama." Then, on your menu bar, go to "Window" / "Freeze Panes." A dark line will appear above row 7. And now, when you scroll down, the column headings stay in place. Sorting Data Let's put the states in order by their 2000 population—the number in column B. First, we must select the data that we want to sort: everything from cell A7 ("Alabama") to cell E57 (the 1990 ranking, the final piece of data, for Wyoming). So click on A7. Then, scroll down to where you can see cell E57. Hold your "Shift" key down, then click on cell E57. This will select everything from your first click (A7) to your last click (E57).
Then, on your menu bar, go to "Data" / "Sort." Tell Excel to sort the selected data by column B in descending order:
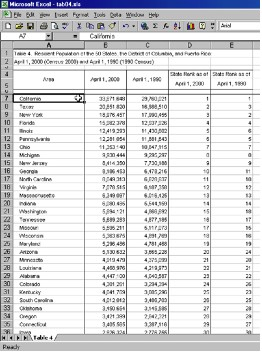
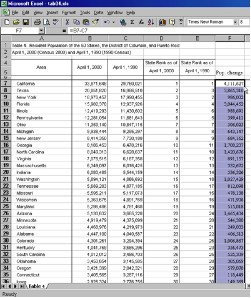
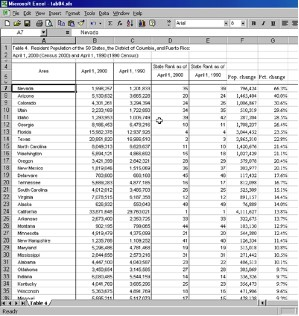
Click "OK," and scroll to the top of your spreadsheet (or as a shortcut, hit the "Ctrl" and "Home" keys simultaneously). You will see that the most populous states now are on top:
Adding Columns of Numbers Even though this table contains nationwide totals, it's a good idea to check the Census Bureau's math. If we found a mistake here, that would certainly be a story! We want to add everything in column B from cell B7 to cell B57. So scroll down until you can see row 57 and below. There is already a blank row (row 58) under row 57. This row 58 is extremely narrow—so narrow you can't even see the "58." To make the row wider, put your cursor on the gray column of row numbers, on the line that separates row 58 from row 59. Your cursor will turn to a double-sided arrow. When it does, double-click, and row 58 will appear as normal height. (This formatting trick also works when columns are too narrow. Another solution is to select the row you want to widen, and, on your menu bar, go to "Format" / "Row.")
After you have widened row 58, let's insert a new, blank row. Select row 58 by clicking on the gray "58." Then, on your menu bar, go to "Insert" / "Rows".
Now you have two blank rows under row 57. In cell A58, type "Calculated state total." Then, put your cursor in cell B58. Here's where we want to add everything from B7 to B57. So, on your toolbar, click on the Greek letter sigma, Excel's AutoSum button. When you do, Excel will display in cell B58 a formula: "=SUM(B7:B57)". This means that Excel is ready to sum all the numbers between B7 and B57.
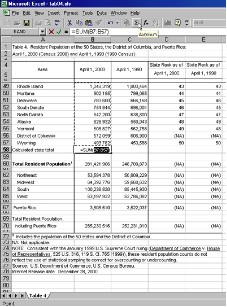
Hit "Enter," and the answer appears. The sum of the 2000 populations of the states was 281,421,906. Then, put your cursor in cell C58 and do the AutoSum procedure on column C, the 1990 numbers.
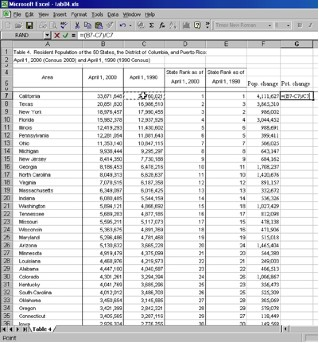
As you can see, our calculated totals are the same as the Census Bureau's. The lesson here is that interviewing data is like interviewing a person: At first you should ask basic questions, things to which you already know the answer, in order to assess whether the source of your information is reliable. Adding and Calculating New Columns of Information One big story out of the 2000 census involves how the population of each state changed during the 1990s: Which states grew the most, or lost population? Unfortunately, this information isn't included in the spreadsheet. But we can add it. In column F, we will show the absolute difference between the 1990 and 2000 population numbers; and in column G, we will show the percentage change. Go to the top of your spreadsheet, and in cell F5, type "Pop. change" or a similar label. Then click in cell F7, where we will build our first formula: California's 2000 population (cell B7) minus its 1990 population (cell C7). Type a "=" sign, to tell Excel a formula is coming. Then type or click on "B7," followed by a minus sign (hyphen), and then "C7."
When you hit "Enter," the answer appears: 4,111,627. Now we want to copy that formula down the rest of the column. So click on F7, the cell with the formula. A box appears around the cell. At the bottom right-hand corner of the box is a black dot, called the AutoFill handle. If you put your cursor on that black dot, it will turn to a thin black cross or crosshairs.
Now you can double-click, and Excel will copy the formula down the column; or you can drag the formula down the column.
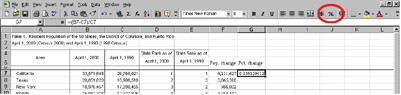
If you click on any of the cells in column F, you'll see that Excel has adjusted the formula as it copied the formula. So, in row 10, the formula is "B10-C10"; and in row 27, it's "B27-C27." Now, in column G, let's calculate the percentage change. In cell G5, we'll put a column heading: "Pct. change." Then in cell G7, we'll type a formula. To calculate percentage change, you take the new figure minus the old figure, then divide by the old figure. In this case, that means taking the 2000 population number minus the 1990 population number, divided by the 1990 population number. We'll need to use parentheses to tell Excel to do the subtraction first, then the division. So here's the formula to type in cell G7: "=(B7-C7)/C7"
Hit "Enter." Excel has expressed the answer as a decimal. To change it to a percent, click on the percent sign on the toolbar:
You can increase the decimal places in your percent by using a toolbar button or going to "Format" / "Cells" on your menu bar. After you have cell G7 looking the way you want, click on the cell and use the AutoFill handle to copy the formula down the column.
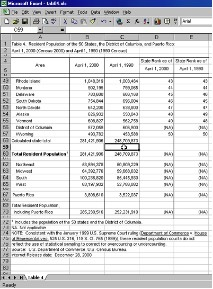
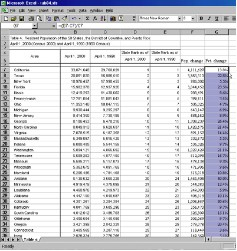
Scroll down to row 58, so you can see the nationwide totals. As a whole, the 50 states and the District of Columbia gained 32,712,033 residents from 1990 to 2000—an increase of 13.2%. Sorting the States According to Their Growth Rates Now let's put the states in order by their percentage change during the 1990s. First, select the data you want to sort: all the state-by-state numbers—everything from cell A7 to cell G57. Then, on your menu bar, go to "Data" / "Sort." Tell Excel to sort the selected data by column G, in descending order.
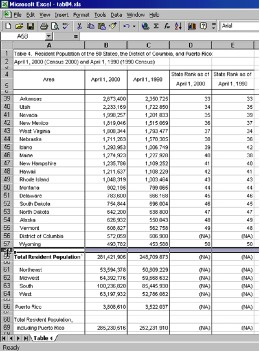
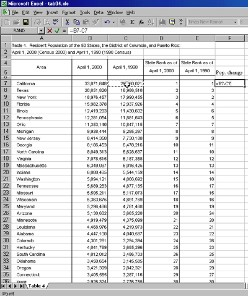
Click "OK" and scroll to the top of your spreadsheet. As you can see, Nevada grew the most—more than 66 percent—during the 1990s. Then came Arizona and Colorado:
If you scroll down, you'll see that the District of Columbia lost nearly 6 percent of its population from 1990 to 2000. Although we did this exercise with a relatively small spreadsheet, Excel can handle tables with as many as 64,000 rows of data. On the Census Bureau's Web site, you can find spreadsheets with demographic data for all 3,000 counties, for example. The Internet also has many resources for learning how to use Excel. Here are my favorites: University of Texas Excel Guide: http://www.utexas.edu/its/training/handouts/UTOPIA_ExcelGS/ The Spreadsheet Page: California State University, Northridge: Beginner's Guide to Excel 2000 |